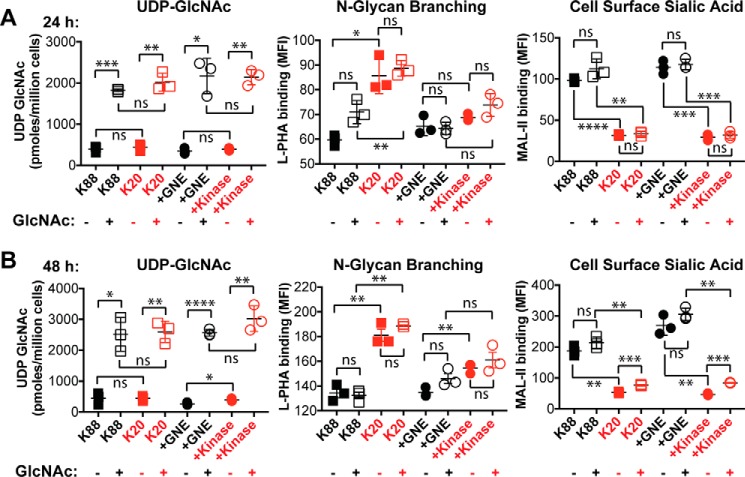
Figure 7.
Free GlcNAc supplementation dramatically increased UDP-GlcNAc levels and also increased N-linked glycan branching. UDP-GlcNAc levels were quantified by HPAEC with UV detection, and cell surface L-PHA and MAL-II lectin binding was measured by flow cytometry after culturing cells for 24 h (A) or 48 h (B). Cell lines labeled in black produce sialic acid, whereas cell lines labeled in red did not express an active GNE epimerase domain and consequently cannot synthesize sialic acid. For all panels, data shown represent three biological replicates, with error bars depicting the mean and S.E. For flow cytometry experiments, each data point represents the MFI of a single sample, typically of 10,000 cells. Flow cytometry experiments were performed at least twice. Statistical significance determined by unpaired Welch's test: **** indicates a p value < 0.0001, *** indicates a p value < 0.001, ** indicates a p value < 0.01, * indicates a p value < 0.05. ns indicates difference not statistically significant.

