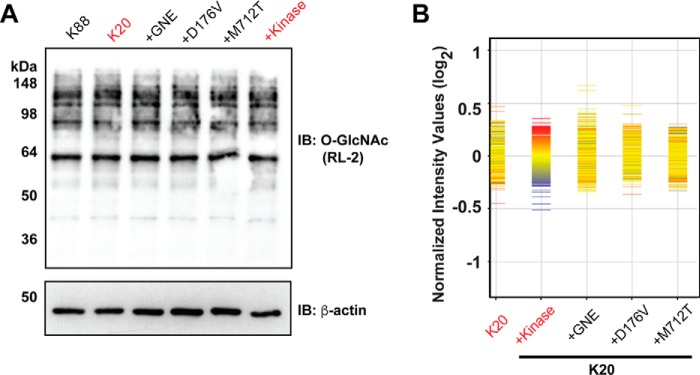
Figure 8.
O-GlcNAc production and gene expression were not affected by GNE activity. A, cell lines were cultured for 2 days. Lysates were probed by immunoblot (IB) using the O-GlcNAc-recognizing antibody, RL-2. B, profile plot of gene expression across different cell lines. Cell lines were cultured for 2 days. Duplicate samples of RNA were hybridized to an Illumina HumanHT-12 v4 BeadChip microarray. The normalized intensity values indicate log2 ratios of gene expression as compared with the average across all cell lines. Cells expressing GNE kinase were used as the reference cell line. Red indicates genes expressed above baseline in the reference cell line, whereas blue indicates genes expressed below baseline in the reference cell line. The red and blue colors are randomly distributed in the non-reference cell lines, indicating there are no gene expression changes that are correlated with GNE activity.

