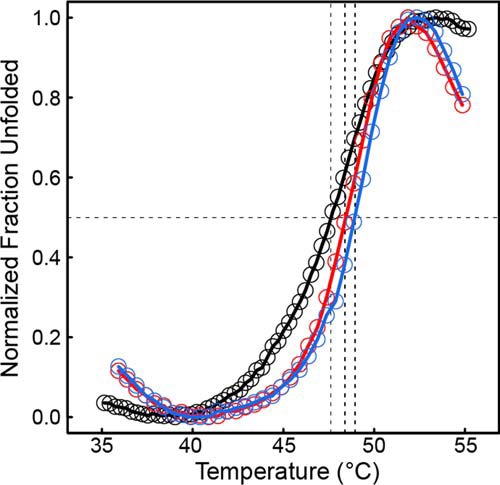
Figure 11.

Deletion of the ALDHSF domain does not result in apparent destabilization of CfPutA tertiary structure. Thermal shift assay melt curves are shown for wild-type CfPutA (black), CfPutA S916* (red), and CfPutA Y927* (blue). The horizontal black dashed line represents 0.5 of the total fraction unfolded. The three vertical dashed lines indicate the T0.5 of each protein. The plotted curves are the average of samples measured in triplicate normalized to fraction unfolded.
