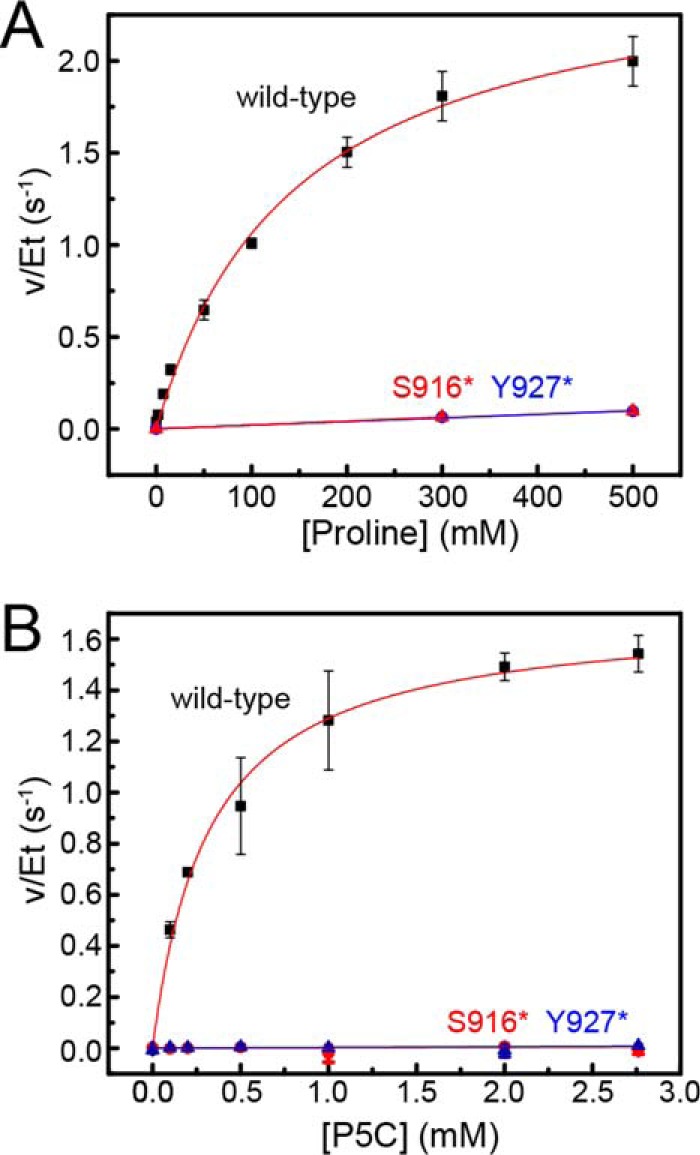
Figure 3.

Steady-state kinetics data. A, dependence of PRODH activity on proline concentration. B, dependence of GSALDH activity on P5C concentration. For both panels, results are shown for wild-type CfPutA (black squares), CfPutA S916* (red triangles), and CfPutA Y927* (blue triangles). Fits to the Michaelis-Menten equation for wild-type CfPutA are represented by the red curves. Linear regression was used for the mutant variants to guide the eye and to estimate kcat/Km for PRODH activity. Analysis was done using Origin 2016.
