
Figure 6.
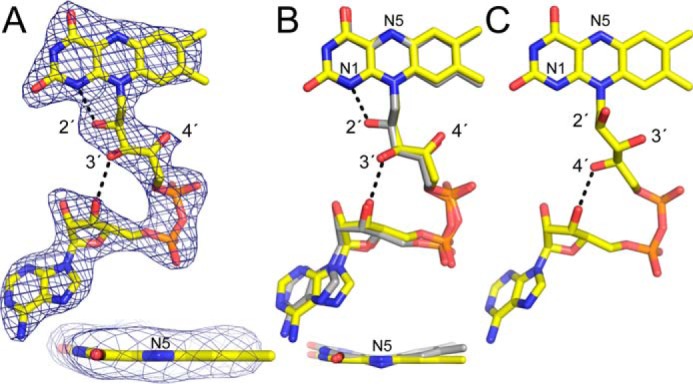
Unexpected FAD conformation. A, 2.7 Å resolution electron density for the FAD in CfPutA. The cage represents a simulated annealing σA-weighted Fo − Fc omit map (3.0σ). The inset shows an edge-on view of the isoalloxazine ring. B, superposition of the FAD in CfPutA (yellow) and the 2-electron-reduced FAD in GsPutA (gray). The inset shows an edge-on view of the isoalloxazine ring. Note that the two FADs have the same ribityl conformation but different butterfly bend angles. C, a typical oxidized PutA FAD (from GsPutA). Note that the ribityl conformation differs from that in B.