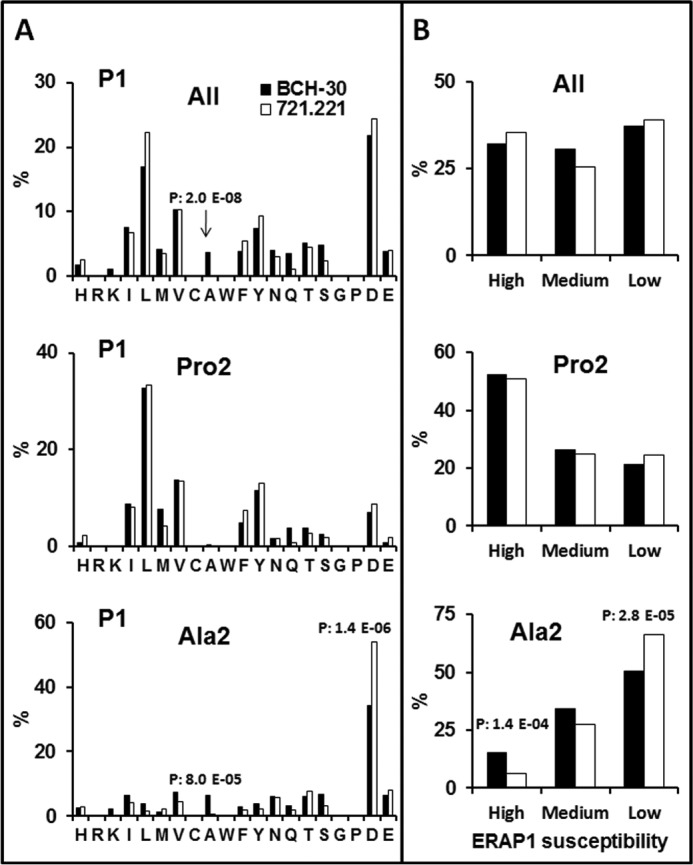
Figure 4.

N-terminal residue usage among B*51:08 ligands and its comparison with B*51:01. A, the percent frequency of P1 residues among 624 B*51:08 ligands (8–12 residues) from BCH-30 cells with the Pro-2/Ala-2 + Val-9/Ile-9 motif and among the Pro-2 (n = 285) and Ala-2 (n = 339) subpeptidomes (black) were compared with the equivalent sets of 1271, 833, and 438 B51:01 ligands, respectively, from 721.221 transfectant cells (white) identified in Ref. 25. Amino acid residues are ordered according to their chemical features: basic (H to K), aliphatic (I to A), aromatic (W to Y), polar (N to S), G, P, and acidic (D and E). B, the P1 residues of the same peptide sets as in A were grouped according to their susceptibility to ERAP1 trimming (35) in high (Y, M, A, and L), medium (C, I, F, S, T, H, Q, G, and N), and low (E, W, D, K, V, R, and P) susceptibility. Statistically significant differences were assessed by the χ2 test with Bonferroni correction, and their p values are specified.
