Figure 1.
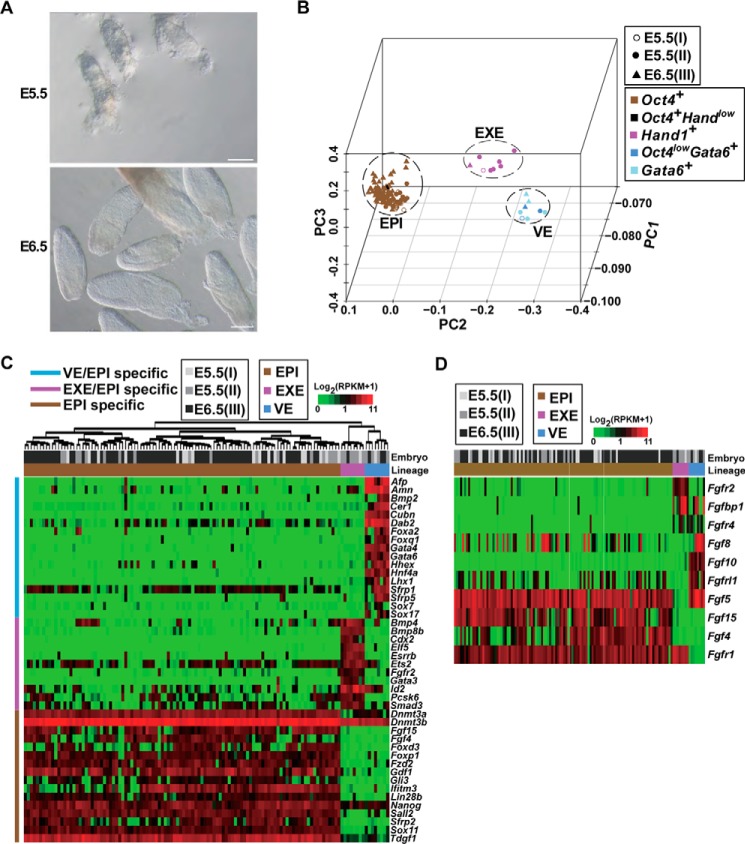
Molecular characterizations of EPI, VE, and EXE cell types in early post-implantation embryos. A, images of E5.5 and E6.5 embryos. Scale bars, 100 μm. B, PC projections of 124 initially sequenced cells collected from embryos I, II, and III with transcriptome data as an input. Different symbols are used to indicate the embryo membership of sequenced cells, and different colors of the symbol are used to present the key molecular feature of the cells in terms of expression of Oct4, Gata6, and Hand1. RPKM >1 was considered expressed. Cells expressing Oct4, Gata6, and Hand1 formed distinct clusters, which were defined as the EPI, VE, and EXE, respectively. Most of the cells expressed only one of the markers (indicated by brown, rose, or light blue colors), except three VE cells that expressed a high level of Gata6 and a low level of Oct4 (indicated by a deep blue color) and one EPI cell that expressed a high level of Oct4 and a low level of Hand1 (indicated by black color). C, the heatmap showing expression patterns of representative specific genes in EPI, VE, and EXE cells. The whole list of genes specific to each cell type is provided in supplemental Table S2. The upper bar indicates the embryo membership of cells, and the lower bar indicates the lineage of cells. The left-hand-side bar indicates different categories of specific genes. Cells were clustered by the euclidian distance and ward linkage. D, differentially expressed FGF ligands and receptors in EPI, VE, and EXE cells, which are arranged in the same order and denoted in the same way as in C.

