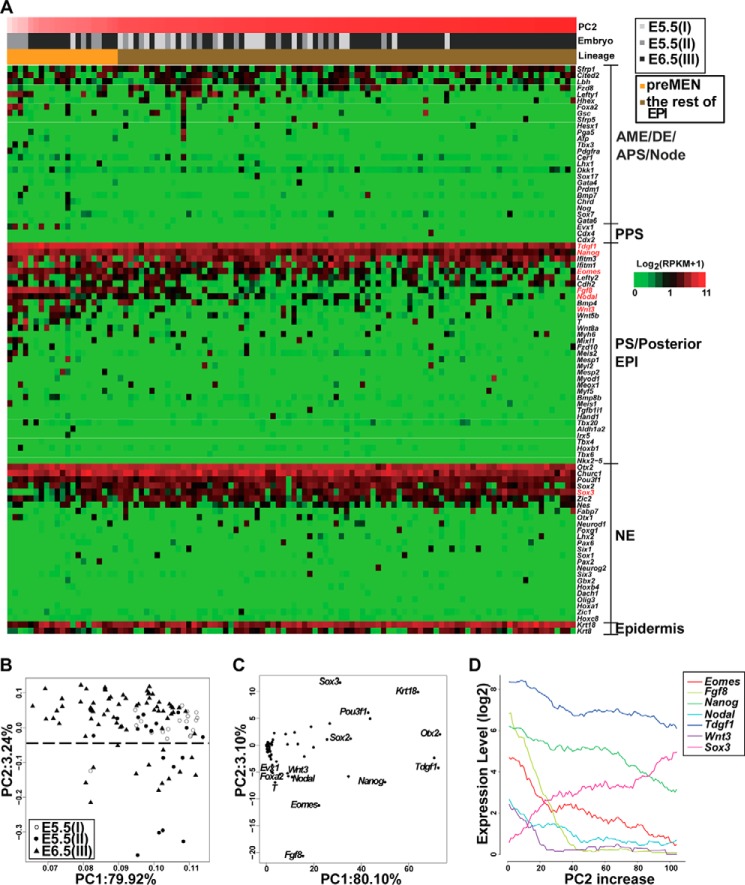
Figure 2.
Identification and analysis of the pre-MEN subgroup in EPI cells. A, heatmap showing distribution of 90 germ-layer markers in 108 EPI cells collected from embryos I–III. The markers were classified into five categories as indicated on the right side. The bars above the heatmap indicate PC2 scores, the embryo membership, and lineages of cells, respectively. Cells are arranged according to their PC2 scores (B) so that pre-MEN cells are on the left. Fgf8, Eomes, Nanog, Tdgf1, Wnt3, Nodal, and Sox3 are colored in red. B, the PCA of 108 EPI cells by 90 germ-layer markers. A dashed line was drawn according to the clustering of cells. The cells below the dashed line were named pre-MEN cells. C, PC projections of 90 germ-layer markers. There are mainly MEN markers in the bottom region of PC2 axis, whereas NE marker Sox3 is in the top region of the PC2 axis. D, a negative correlation between Sox3 and MEN markers in sequenced cells. For clarity, only some of the genes at the two ends of the PC2 axis in C are shown. The cells on the x axis were sorted according to their projection scores for the PC2 so that pre-MEN cells below the dashed line in B are on the left, and the other EPI cells are on the right. The traces represent moving averages of the given gene's expression level in overlapping windows of 20 cells.

