Figure 3.
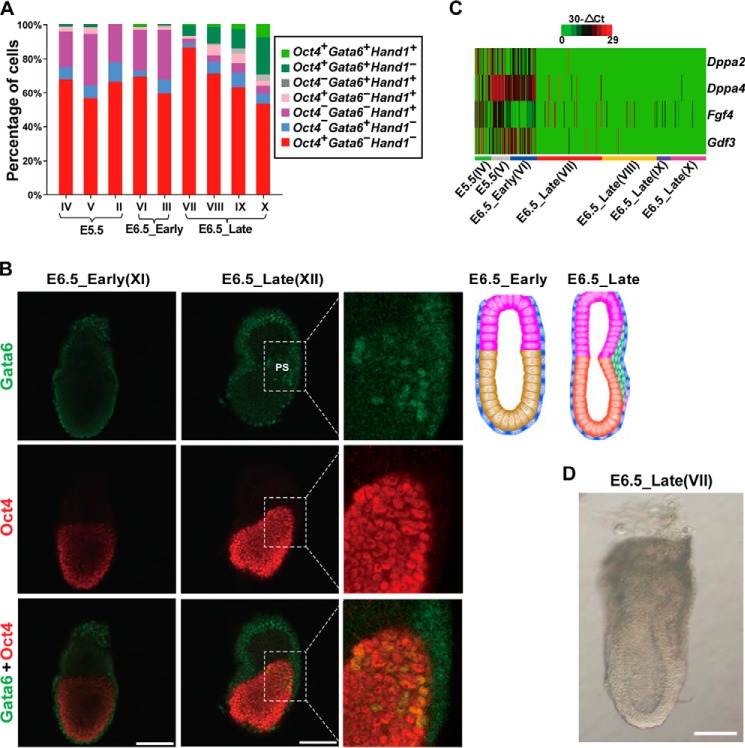
E6.5_Late embryos exhibit distinct molecular characteristics. A, increase in the percentages of Oct4+ Gata6+ cells in E6.5_Late embryos. The levels of Oct4, Gata6, and Hand1 were measured by qRT-PCR. The percentage of cells being single, double, or triple positive for Oct4, Gata6, and Hand1 are shown in different colors. The percentage of Oct4+ Gata6+ cells (including Oct4+Gata6+Hand1− cells and Oct4+Gata6+Hand1+ cells, indicated by deep and light green colors, respectively), increased in cells from E6.5_Late embryos (embryos VII, VIII, IX, and X), compared with cells from E5.5 and E6.5_Early embryos (embryos II, III, IV, V, and VI). Embryo I was an E5.5 embryo, for which the expression of Oct4, Gata6, and Hand1 was only partially analyzed. Thus, cells from the embryo I were not used in the statistical analysis in A. B, coexpression of Gata6 and Oct4 in an E6.5_Late embryo (XII) but not in an E6.5_Early embryo (XI). Whole embryos were double-immunostained with anti-Oct4 and anti-Gata6 antibodies. Confocal images were acquired as z-stacks of xy images. However, only one of the xy images is shown for clarity. Images containing Gata6 staining were processed once by the median filter (at the parameter 3*3) in the Image-Pro Plus software to reduce background noises. Schematic figures of E6.5_Early and E6.5_Late embryos are shown on the right side. Scale bars, 100 μm. C, the heatmap showing the decrease in the expression of some pluripotency markers in E6.5_Late embryos. Only cells being single-positive for Oct4 (Oct4+Gata6−Hand1−) were included in the analysis. The levels of Fgf4, Dppa2, Dppa4, and Gdf3 were measured by single-cell high-throughput qRT-PCR and normalized to the level of Gapdh. D, an image of the embryo E6.5_Late (VII). Scale bar, 100 μm.

