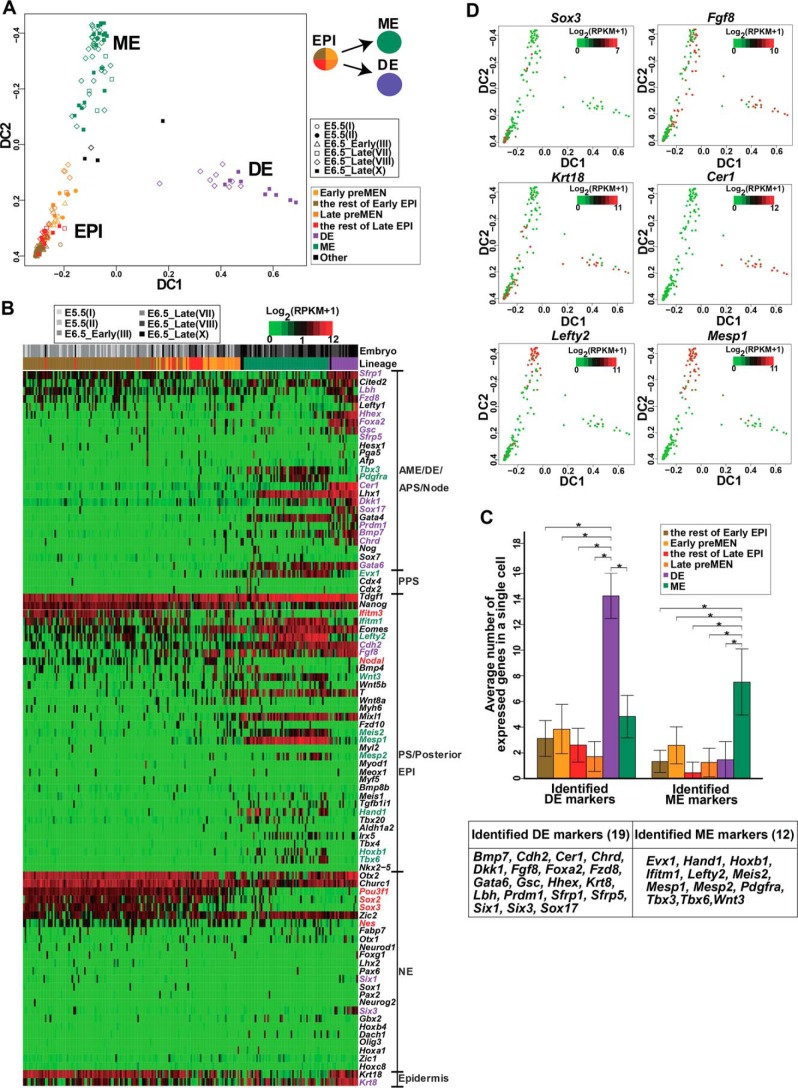
Figure 4.
Segregation of ME and DE lineages in cells from E6.5_Late embryos. A, diffusion map representation of 214 sequenced cells, including 108 cells from E6.5_Early embryos (I, II, and III) and 106 cells from E6.5_Late_embryos (VII, VIII, and X). The 214 cells were identified to be embryonic cells in supplemental Fig. S4A. The same 90 germ-layer markers used in Fig. 2A were used as the input. The first two diffusion components (DC1 and DC2) are shown. Shapes indicate the embryo membership of cells, and colors indicate the lineages. Clusters are designated as the EPI, DE, and ME according to markers enriched in them. The Early pre-MEN and the rest of Early EPI cells were from E5.5 and E6.5_Early embryos (I, II, and III), defined according to the position of cells on the PCA map (see Fig. 2B). Late pre-MEN and the rest of Late EPI cells were from E6.5_Late embryos (VII, VIII, and X), defined here according to the distance to the branching point of DE and ME cells. Therefore, the EPI cluster contains four subgroups: Early Pre-MEN, the rest of Early EPI, Late pre-MEN, and the rest of Late EPI. B, the heatmap showing expression patterns of 90 germ-layer markers in 214 embryonic cells. The bars above the heatmap indicate the embryo membership and lineages, respectively. Cells are arranged according to their positions on the diffusion map as in A, with EPI cells and ME cells arranged from the bottom to top of the DC2 axis, and DE cells arranged from the left to right of the DC1 axis. Markers are arranged and grouped in the same way as in Fig. 2A. The markers specific for EPI, ME, and DE groups (against the other two groups, Mann-Whitney U test, FDR <0.05) are highlighted in red, green, and purple, respectively. C, statistical analysis revealing coexpressed patterns of DE and ME marker genes in DE and ME cells, respectively. DE and ME markers are highlighted as in B and are listed in the lower panel. The average number of expressed DE and ME markers (RPKM >1) in a single cell of each cell type (Early pre-MEN, the rest of Early EPI, Late pre-MEN, the rest of Late EPI, DE, and ME) was calculated and displayed. Data are represented as mean ± S.D. The number of expressed DE and ME markers significantly increased (Mann-Whitney U test, p < 0.01, denoted by stars) in DE and ME cells, respectively, compared with the other types of cells. D, expression patterns of several genes across the developmental trajectories. The expression levels of individual genes were overlaid onto the diffusion plot.

