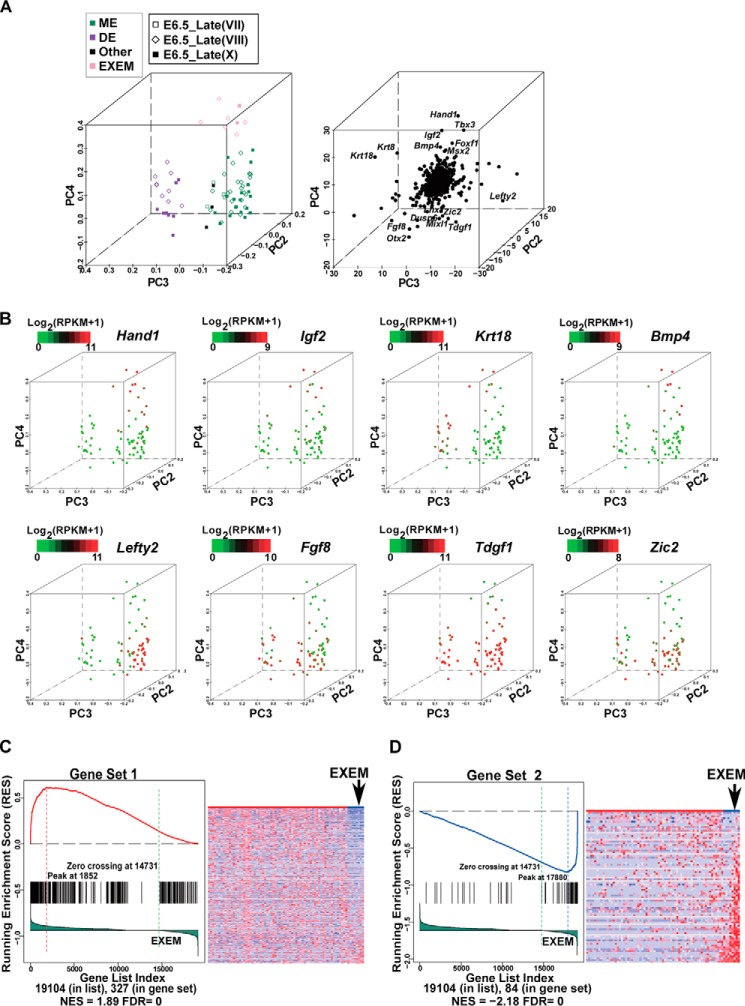
Figure 6.
Identification of EXEM cells in E6. 5_Late embryos. A, the PCA of 75 identified MEN cells by 822 germ-layer markers. The projection components PC2-PC3-PC4 are displayed. The 75 cells were from the DE, ME, and Other clusters shown in Fig. 4A. Expression levels of the 822 germ-layer markers determined by RNA-Seq were used as the input. The left panel is PC projections of cells. Cells clustered at the top end of PC4 are marked by the light rose, denoting putative EXEM cells. The right panel is PC projection of genes. Some genes with extreme PC4 loadings are shown. B, expression patterns of representative genes overlaid on the PCA map. Cells at the top of the PC4 axis in A exhibit distinct gene expression patterns from the rest of MEN cells. C, GSEA reveals similarities between genes down-regulated in E6.5_Late EXEM cells and those down-regulated in E7.0 EXEM cells. Genes down-regulated in E7.0 EXEM cells as compared with the rest of E7.0 ME cells were obtained from the published data (27), designated as “Gene Set 1,” including 330 genes. The cells in A were divided into EXEM cells and the rest of MEN cells. All genes (the total number was 19,104) were ranked according to the correlation with the classification of the two groups. The lower portion of the left figure shows the rank-ordered genes for EXEM cells compared with the rest of MEN cells, with genes being highly down-regulated to the far left and up-regulated genes to the right. Each black line represents a hit from Gene Set 1 in the rank-ordered gene list. The upper part of the left panel shows the running enrichment score (RES), which was calculated by walking down the rank-ordered gene list, and increasing the score when a gene was met in the Gene Set 1 and decreasing it when it is not. The NES and the FDR, which reflect the correlations in GSEA, were calculated and exhibited in the bottom region. The right panel is a heatmap revealing the expression of 330 genes of Gene Set 1 in EXEM cells and the rest of MEN cells. Genes are ordered according to their ranks in the left panel, and cells are ordered according to their PC4 loadings in A. D, GSEA reveals similarities between genes up-regulated in E6.5_Late EXEM cells and those up-regulated in E7.0 EXEM cells. Genes up-regulated in E7.0 EXEM cells as compared with the rest of E7.0 ME cells were obtained from the published data (27), designated as “Gene Set 2,” including 84 genes. All genes (the total number was 19,104) were ranked and arranged in the same way as in C. Each black line represents a hit from the Gene Set 2 in the rank-ordered gene list. The RES, NES, and FDR values are shown. The right panel is a heatmap revealing the expression of 84 genes of Gene Set 2 in EXEM and the rest of MEN cells. Genes are ordered according to their ranks in the left panel, and cells are ordered according to their PC4 loadings in A.

