
Figure 7.
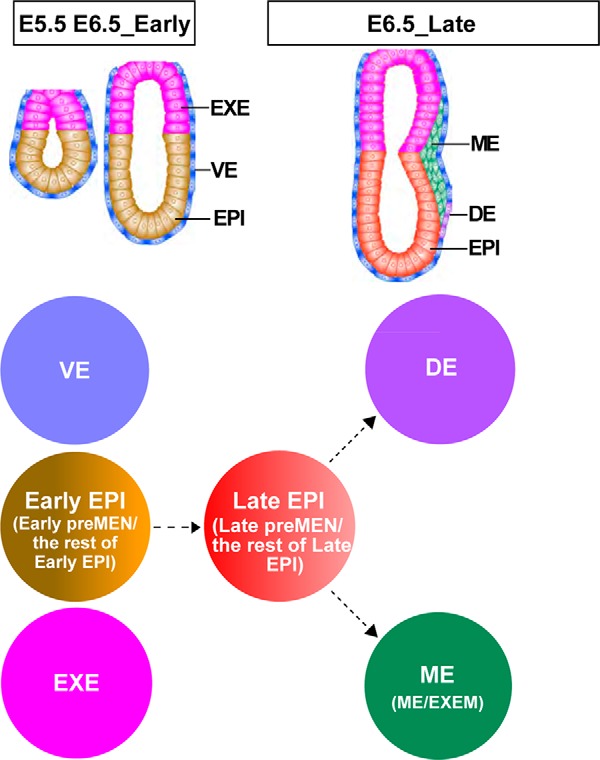
Schematic presentation of cell populations analyzed in this study. The distinct lineages are marked by different colors. The Early EPI are EPI cells from E5.5 and E6.5_Early embryos, containing Early pre-MEN and the rest of Early EPI; the Late EPI are EPI cells from E6.5_Late embryos, containing Late pre-MEN and the rest of Late EPI. The ME is also a mixed population, containing the EXEM and ME. Dashed lines are used to denote the putative relationship among different populations.