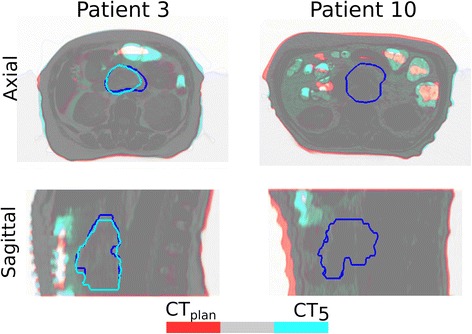
Fig. 2.

Overlay of the planning CT (red) and the CT of the week 5 (blue) for the patient 3 and 10. The grey color means perfect overlay between the patient anatomy and the red/blue color the region with anatomy changes (i.e. bowel, stomach and weight loss). The dark blue contour represents the planning CTV, while the light blue the CTV of the week 5 CT
