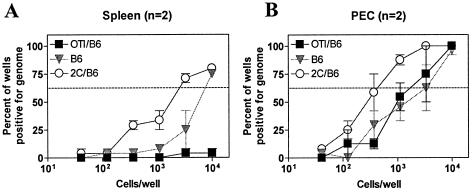
FIG. 7.
OTI T cells control the frequency of genome-positive cells during latency at 42 days after infection. Shown are the results of a limiting dilution PCR assay, specific for gene50, on splenocytes (A) and peritoneal cells (PEC) (B) from either OTI/B6 (filled squares), 2C/B6 (open circles), or B6 (filled inverted triangles) animals infected with γHV68.OVA (106 PFU, i.p.) for 42 days. In panel B the difference between OTI/B6 (filled squares) and 2C/B6 (open circles) is statistically significant (P < 0.032). n, number of experiments.

