Fig. 6.

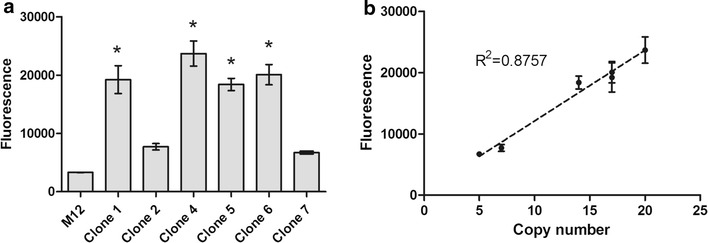
Intracellular EGFP production. a Flow cytometry analysis of the cells positive for EGFP production. b Correlation between copy number and EGFP production. M12 leu2 strain. Error bars represent standard error of the mean. Asterisks indicate significant difference between the evaluated clone and the M12 control strain according to ANOVA followed by Tukey’s post-test (p < 0.05)
