Fig. 4.

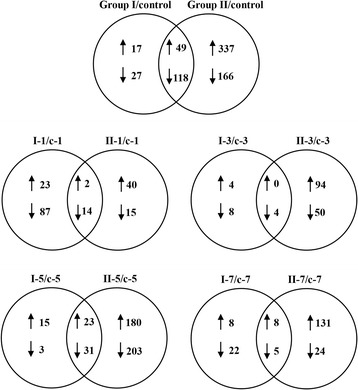
Venn diagram of differentially expressed genes between the two groups. Venn diagram showing the differentially expressed genes common to Groups I and II in total and at each time-point

Venn diagram of differentially expressed genes between the two groups. Venn diagram showing the differentially expressed genes common to Groups I and II in total and at each time-point