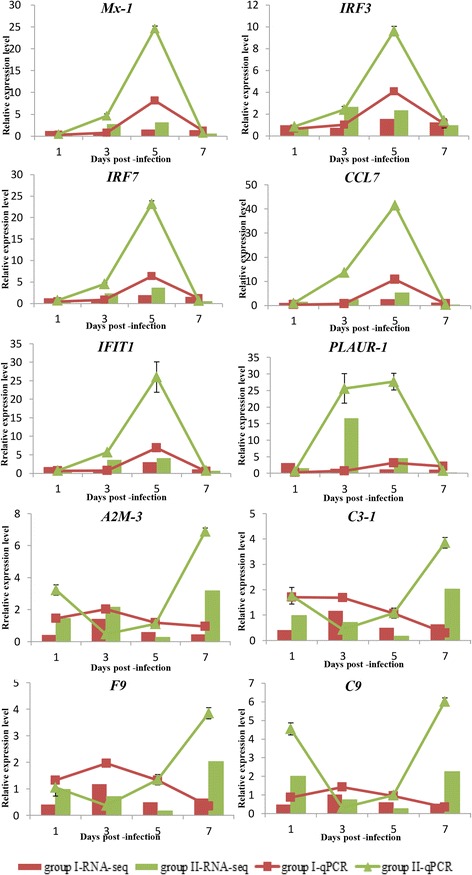
Fig. 8.

Confirmation of the transcriptome sequencing data by RT-qPCR. Five DEGs participating in immune responses and five DEGs involved in “complement and coagulation cascades” were selected for RT-qPCR. The relative expression levels of DEGs was calculated as the ratio of gene expression level relative to that in the Control group at the same time-point. All data represent the mean ± standard deviation of three replicates
