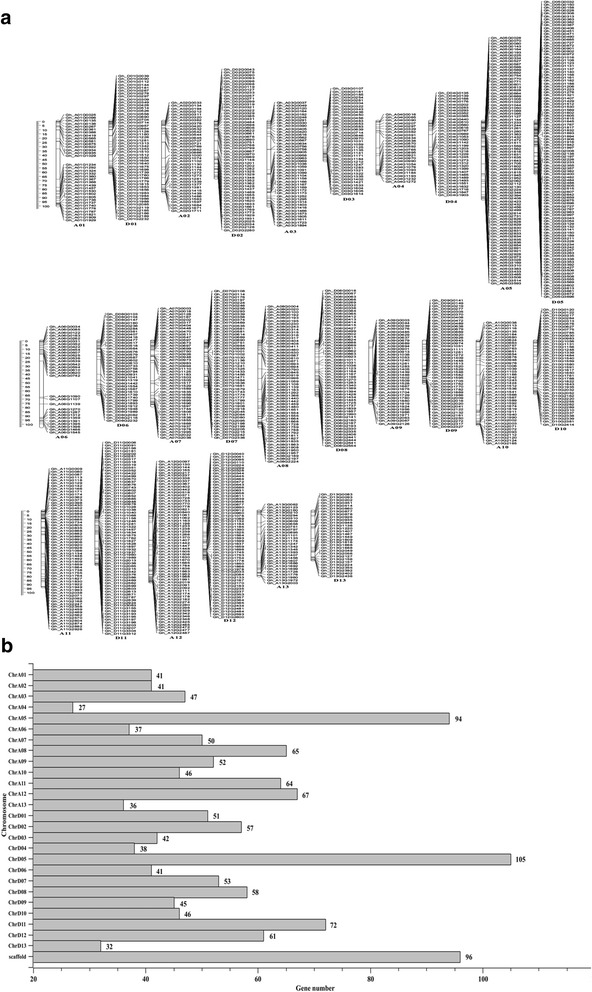
Fig. 2.

Distribution of the differentially expressed genes on different chromosomes. a Location distribution of DEGs on different chromosomes. b DEG numbers on different chromosomes. The Y-axis represents different chromosomes. xis and numbers behind each bar represent the DEG numbers on each chromosome
