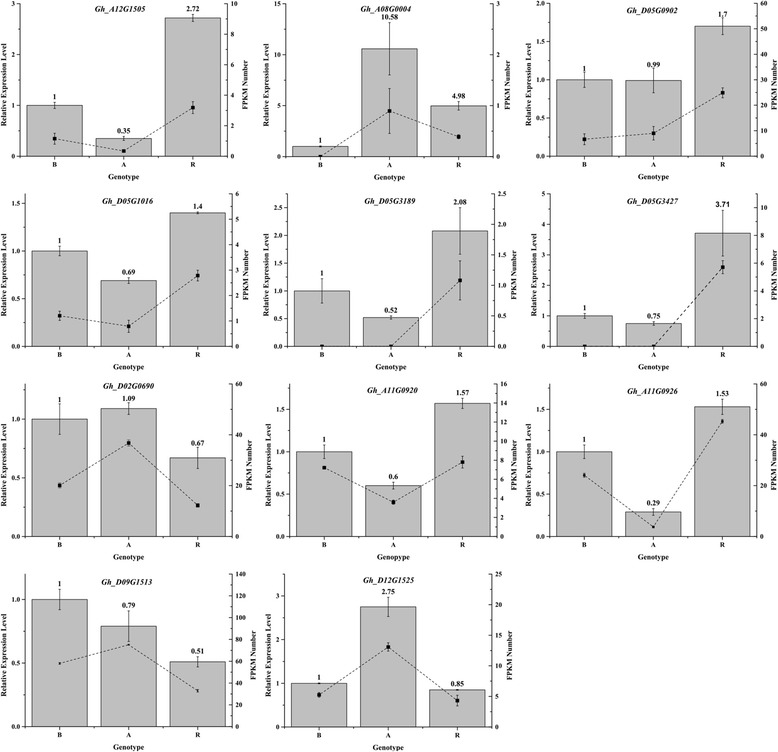
Fig. 5.

qRT-PCR analysis of gene expression compared with the RNA-seq data. The gray columns represented the relative expression levels of the genes; the dotted lines represent the RNA-seq reads. A: sterile line, B: maintainer line, R: restorer line

qRT-PCR analysis of gene expression compared with the RNA-seq data. The gray columns represented the relative expression levels of the genes; the dotted lines represent the RNA-seq reads. A: sterile line, B: maintainer line, R: restorer line