
Fig. 6.
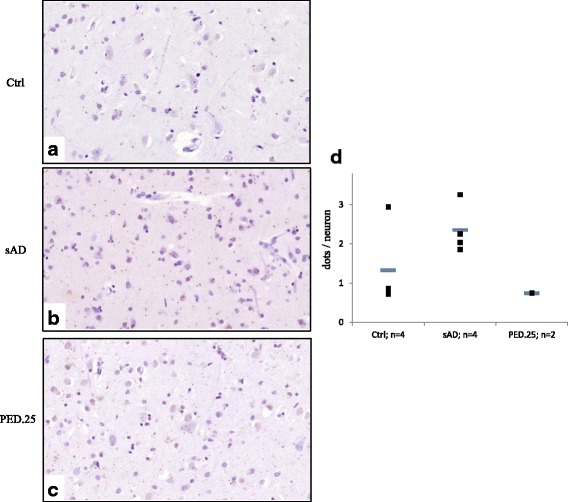
Co-localization between SORL1 and APP in postmortem brain as detected by in situ PLA. a-c shows representative sections of the three groups; a Ctrl = controls, b sAD = sporadic AD, and c PED.25 = affected family member from PED.25. d The mean number of PLA dots/neuron, represented as horizontal bars (−), was quantified in pyramidal neurons in frontal cortex from controls (n = 4), sporadic AD (n = 4) and PED.25 (n = 2). A minimum of 100 neurons was quantified from every individual. The individual values are represented as filled squares (■)