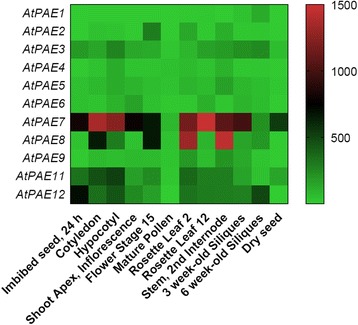
Fig. 6.

PAE gene expression pattern derived from eFP Browser database during development in A. thaliana. The expression profile of all AtPAEs during plant growth and development was retrieved from the eFP Browser database [79]. Heatmap generation was performed using GraphPad Prism 7.0 software (GraphPad Software, Inc.). The color scale below the heat map indicates expression values; green indicates low gene expression while red indicates high gene expression
