. 2017 Mar 10;8(5):3891–3897. doi: 10.1039/c6sc05616d

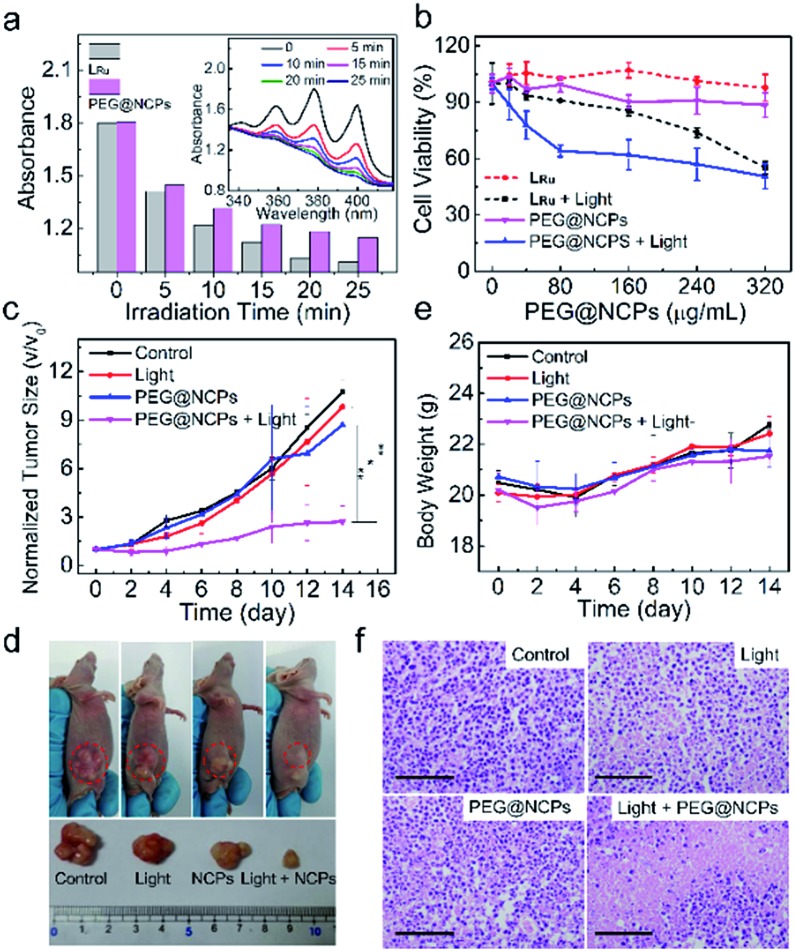
Fig. 6. (a) UV-vis absorption intensity of ABDA at 380 nm after the addition of LRu or the PEG@NCPs and then irradiation for different time periods. Inset: the corresponding UV-vis absorption spectra of the mixture of ABDA and the PEG@NCPs with different irradiation time periods. (b) Viability of HepG2 cells with and without 480 nm excitation for 10 min after incubation with different concentrations of LRu or the PEG@NCPs for 10 h. (c) Tumor size, (d) representative photographs, and (e) body weight of HepG2 tumor-bearing mice after different treatments: (left to right) without any treatment (control), with light irradiation only, injection with the PEG@NCPs only, and injection with the PEG@NCPs followed by light irradiation at a power density of 0.1 W cm–2 (n = 4). (f) H&E stained images of the tumors from different groups. Scale bars: 100 μm.

Fig. 6