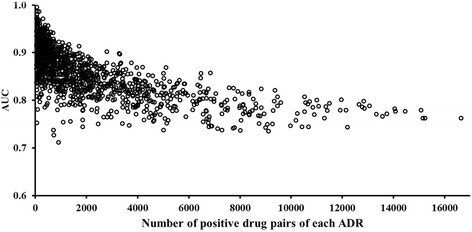
Fig. 6.

Area under receiver operating characteristic curve (AUC) for 1,096 models of adverse drug reactions (ADRs), estimated from 10-fold cross-validation studies. Each circle represents an ADR prediction model with its AUC value on the vertical axis and the number of drug pairs that induced this ADR on the horizontal axis. The ADR model with the most drug pairs was nausea (Unified Medical Language System code C0027497), with >16,000 constituent pairs
