
Fig. 4.
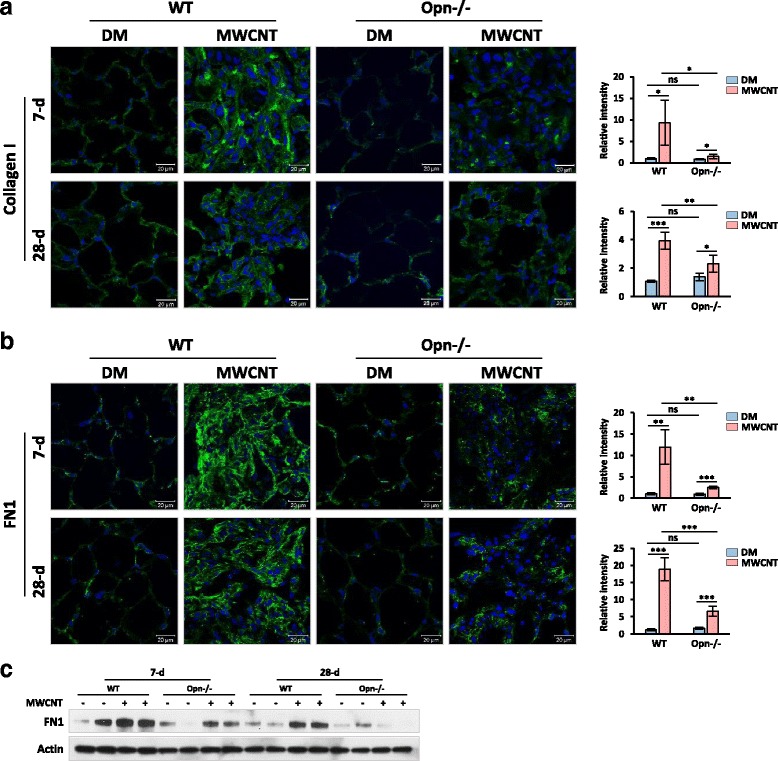
Quantification of fibrotic matrix protein expression. WT and Opn KO mice were exposed to DM or 40 μg MWCNTs for 7 or 28 days. (a) Immunofluorescence of Collagen I on mouse lung sections. (b) Immunofluorescence of FN1 on mouse lung sections. In (a) and (b), green indicates positive staining, and blue indicates nuclear staining (scale bar: 20 μm). Relative intensity of positive staining was measured and presented as mean ± SD (n = 4). (c) Immunoblotting of FN1 (n = 2). Actin was used as the loading control