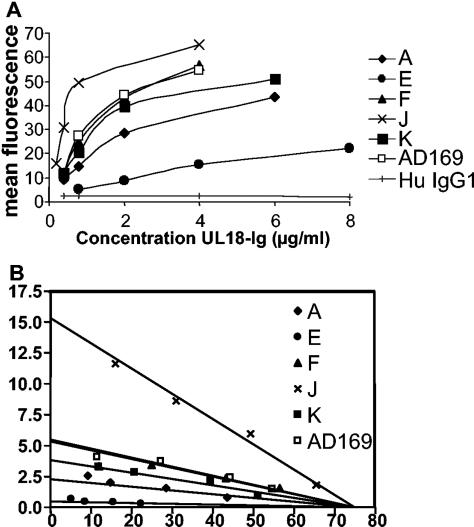
FIG. 3.
Titration of the binding of UL18 genetic variants to ILT2-transfected cells. (A) RBL-ILT2 cells were stained with the indicated concentrations of the various UL18-Ig proteins and analyzed by flow cytometry. The graph shows the measured fluorescence plotted against the concentration used for staining. Data are representative of those from three experiments. (B) Scatchard transformation of the data shown in panel A.

