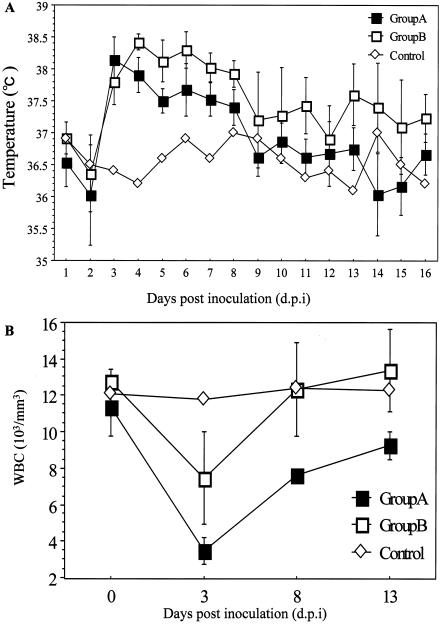
FIG. 1.
Clinical changes in civets after inoculation with SARS coronavirus (SARS-CoV). (A) Daily average temperature of animals in groups A and B plotted together with the daily temperature of the control animal. Febrile episodes commenced around 3 dpi, and temperatures remained elevated for up to 7 days in infected civets. (B) White blood cell (WBC) counts measured on day 0 and at 3, 8, and 13 dpi for the control animal and animals in groups A and B. For animals in groups A and B, the average counts are used in the plot. Leucopenia was observed, with white blood cell counts reaching a minimum at approximately 3 dpi and recovering to about normal levels from 13 dpi.

