FIG. 4.
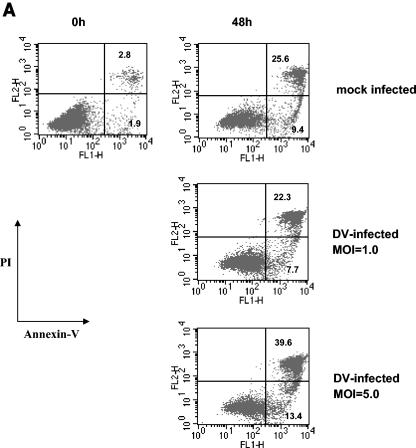
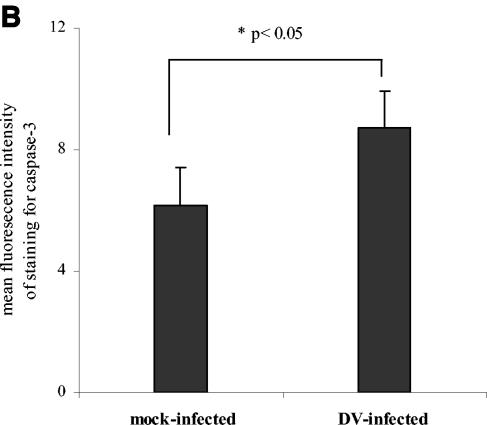
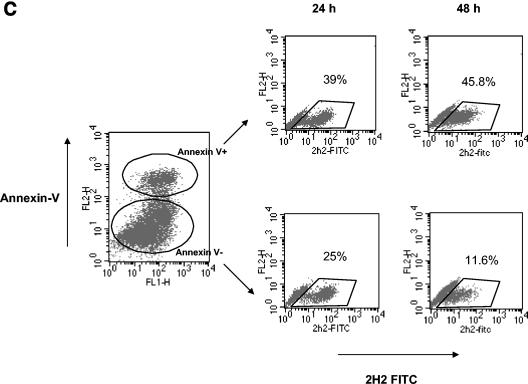
DV-infected DCs undergo apoptosis. (A) FITC-conjugated annexin V and PI staining of DV-infected and mock-infected (uninfected) DCs. The percentages of annexin V-positive, PI-negative cells representing early stage apoptosis and the percentages of annexin V-positive, PI-positive labeling representing end-stage apoptosis are shown. (B) Active caspase 3 levels in DV- and mock-infected cultures. The values are the means ± standard errors of the means (error bars) for three experiments. The values for mock- and DV-infected cultures (asterisk) were significantly different (P ≤ 0.03) by a paired t test. (C) At 24 and 48 h postinfection, DV-infected DCs were stained with annexin V MAb, and the annexin V-positive and -negative cells (Annexin V+ and Annexin V−, respectively) were subsequently isolated using an apoptotic cell isolation kit. Both populations were fixed, permeabilized, and stained with FITC-conjugated MAb 2H2 (2H2 FITC). The percentage of 2H2-positive cells in each fraction is shown. The data are representative of two separate experiments.


