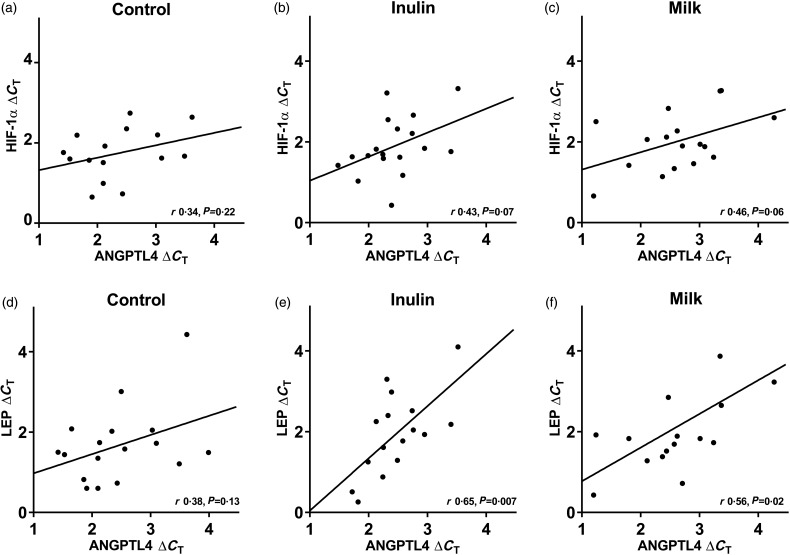
Fig. 2.
Correlations (r) between angiopoietin-like protein 4 (ANGPTL4) and hypoxia-inducible factor 1α (HIF-1α) mRNA in adipose tissue after control (a, n 15), inulin (b, n 18) and milk (c, n 17) diets, together with correlations between ANGPTL4 and leptin (LEP) mRNA after control (d, n 17), inulin (e, n 16) and milk (f, n 16) diets. Expressed in ΔCT and calculated by Pearson's product moment correlation coefficient.

