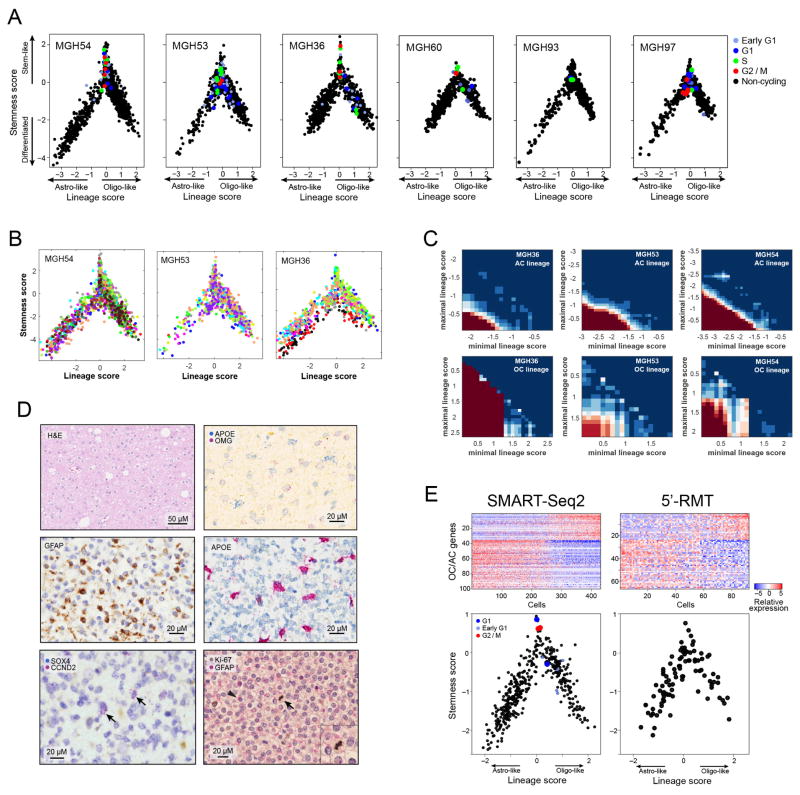
Extended Data Figure 5. Developmental hierarchy in oligodendroglioma.
a, Shown are plots as in Fig. 2d for each of the six tumours with cycling cells coloured as in Fig. 3. b, Lineage and stemness scores for three tumours with high-depth profiling, coloured based on sequencing batches, demonstrating the lack of considerable batch effects. c, For each of the three tumours profiled at high depth (horizontal panels) and for the two lineages (vertical panels), we calculated the significance of co-expression among sets of AC-related (top panels) or OC-related (bottom panels) genes within limited ranges of lineage scores (between the value of the x axis and that of the y axis). Significance was calculated by comparison of average co-expression to that of 100,000 control gene-sets with similar number of genes and distribution of average expression levels, and is indicated by colour. The significant co-expression patterns within limited ranges of lineage scores suggest that variability of lineage scores in these ranges cannot be driven by noise alone, and implies the existence of multiple states within each lineage, presumably reflecting intermediate differentiation states (see Supplementary Note 2). d, Characterization of tumour subpopulations by histopathology and tissue staining. Top/middle panels denote two predominant lineages of AC-like and OC-like cells. Shown are MGH53 with haematoxylin and eosin (H&E, top left), immunohistochemistry for OLIG2 (oligodendrocyte marker, top right) and GFAP (astrocyte marker, middle left), as well as in situ RNA hybridization for astrocytic markers ApoE (apolipoprotein E, astrocytic lineage, middle right), with patterns similar to GFAP immunohistochemistry. Bottom panels denote stem-like cells and association with cell cycle. In situ RNA hybridization for the stem/progenitor markers SOX4 and CCND2 (bottom left) and the proliferation marker Ki-67 (bottom right) in MGH36 identifies cells positive for both markers (arrows). Immunohistochemistry for GFAP (arrowhead, bottom right) and Ki-67 (arrow, bottom right) shows mutually exclusive expression patterns. e, Consistency of MGH60 hierarchy between the full-length SMART-Seq2 protocol used throughout this work (left panels), and an alternative protocol (right panels) in which only the 5′-ends of transcripts are analysed while incorporating random molecular tags (RMTs, also known us unique molecular identifiers, or UMIs) that decrease the biases of PCR amplification. Top panels: PC1 reflects an AC-like and OC-like distinction. Shown are heatmaps of the AC-like and OC-like specific genes (rows, as defined in Supplementary Table 1 and restricted to genes with average expression log2(TPM + 1) > 4 in each data set) with cells ordered by their PC1 score. Bottom, lineage (x axis) and stemness (y axis) scores (defined as in Fig. 2d).

