
Figure 5. Localization of F. nucleatum to Established CRC Tumors Requires Fap2.
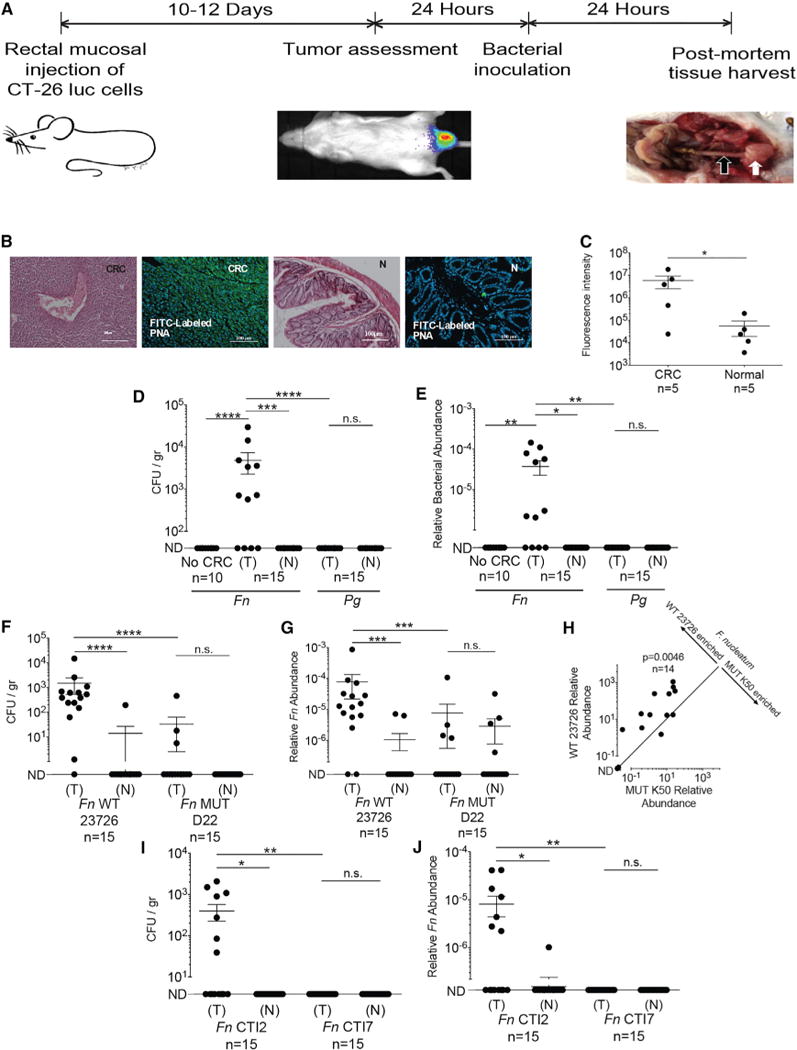
(A) Experimental scheme: orthotopic rectal CT26 mouse CRC model. When tumors were 2,500 mm3, mice were randomized to a bacterial inoculation group. White arrow indicates tumor, black arrow adjacent normal colon.
(B and C) Gal-GalNAc overexpression in the CT26 mouse CRC model. (B) Representative image of CT26 orthotopic tumor stained with H&E or with FITC-labeled Gal-GalNAc-specific PNA (green) and Hoechst dye (blue). CRC denotes images of tumors, and N denotes images of adjacent normal tissue. (C) Quantitative analysis of PNA binding to each section (sum of fluorescence intensity of analyzed section). n, number of mice. Error bars indicate mean ± SEM. *p = 0.0313, Wilcoxon signed-rank test.
(D and E) Preferential enrichments of F. nucleatum ATCC 23726 in CRC tumors. (D) Abundance (CFU/gr tissue) and (E) relative fusobacterial gDNA abundance (2−ΔCt) in colon samples from non-CT26 transplanted, tumor-free mice (no CRC), inoculated intravenously (IV) with 5 × 10⁶ to 1 × 10⁷ F. nucleatum ATCC 23726, in tumor (T) and normal adjacent tissues (N) from CT26-tumor-bearing mice (n = 15) inoculated IV with 5 × 10⁶ to 1 × 10⁷ F. nucleatum ATCC 23726 and in tumor (T) and normal adjacent tissues (N) from CT26-tumor-bearing mice (n = 15) inoculated IV with 5 × 10⁶ to 1 × 10⁷ P. gingivalis ATCC 33277 (Pg). ****p < 0.0001,**p < 0.01, Mann-Whitney U test; ***p = 0.0005, *p < 0.05, Bonferroni-corrected Wilcoxon signed-rank test. n.s., not statistically significant.
Each symbol represents data from individual mice. Data reflect one representative experiment out of three performed in (B) and (C) and two in (D) and (E). Error bars show mean ± SEM.
(F–J) Fap2 mediates fusobacterial localization in CT26 CRC model mice. (F) CRC colonization (CFU/gr tissue) by IV inoculated F. nucleatum ATCC 23726 (Fn WT 23726) or Fap2-deficient mutant D22 (MUT D22). ****p < 0.0001, Bonferroni-corrected Wilcoxon signed-rank test for (T) versus (N); ****p < 0.0001, Mann-Whitney U test for (WT 23726) versus (MUT D22). (G) Relative fusobacterial gDNA abundance (2−ΔCt) of wild-type Fn (WT) and of the Fap2-deficient isogenic mutant D22 in tumor (T) versus matched adjacent normal tissue (N) from the samples in (F). Error bars indicate mean ± SEM; ****p < 0.0001, ***p = 0.0002, Mann-Whitney U test.
(H) Tumor enrichment of Fn and the Fap2-deficient mutant K50 IV inoculated as a mixture; **p = 0.0046, Bonferroni-corrected Wilcoxon signed-rank test. (I and J) Tumoral enrichment of inoculated Fap2-expressing CTI-2 or of the Fap2-deficient CTI-7 in tumor (T) and normal tumor-adjacent tissues (N), quantified by plating (I) or by qPCR (J) as relative gDNA abundance in tumor versus matched adjacent normal tissue (2−ΔCt); *p = 0.0156, **p = 0.0064, Bonferroni-corrected Mann-Whitney U test. Figures show data from one of two representative experiments performed.