
Figure 6. Fusobacterial Presence in CRC Metastases Is Facilitated by Fap2 Binding to Host Gal-GalNAc.
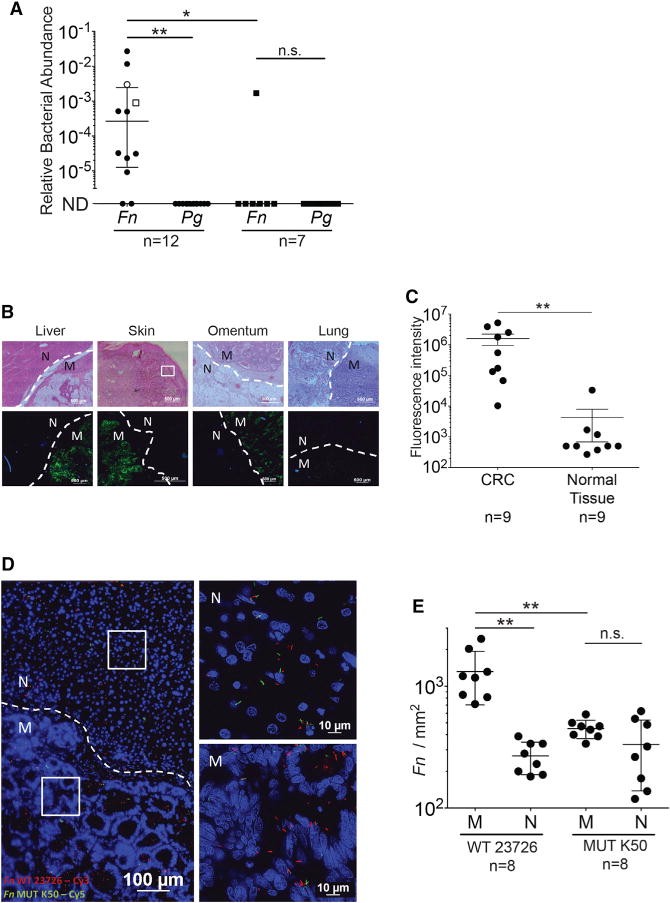
(A) Relative fusobacterial (Fn) and P. gingivalis (Pg) gDNA abundance (2−ΔCt) in human CRC metastases and in tumor-free liver biopsy samples. Open circle represents metastasis in the omentum, and open square represents metastasis in the lung. Filled circle are liver metastases. Filled squares represent tumor-free liver. Error bars indicate mean ± SEM; **p = 0.004, Bonferroni-corrected Wilcoxon signed-rank test; *p = 0.031, Bonferroni-corrected Mann-Whitney U test. Each symbol represents data from individual metastatic deposits.
(B) Representative sections of human CRC metastases (M) were stained with FITC-PNA (green) for Gal-GalNAc quantification and with Hoechst (blue). Dashed lines indicate tumor-adjacent normal (N) tissue border.
(C) Quantitative analysis of PNA binding (sum of fluorescence intensity of analyzed field) of the samples described in (B). Each symbol represents the mean of three randomly selected fields for each human tissue section (n = 9). Error bars indicate mean ± SEM; **p = 0.0039, Wilcoxon signed-rank test.
(D) Attachment of Cy3-labeled (red) Fn and of its Cy5-labeled (green) Fap2-inactivated mutant K50 to a representative Hoechst-stained (blue) human CRC liver metastasis section. See Figure S4 for a representative section stained with Cy5-Fn and Cy3-K50, to allay concerns of dye staining bias.
(E) Quantitation of fusobacterial binding (Fn/mm2) of bacteria described in (D) to sections of human CRC metastasis sections (n = 8). Each symbol represents the median of three randomly selected fields per human section. Error bars indicate mean ± SEM; **p = 0.0078, Wilcoxon signed-rank test.
See also Figures S2 and S3.