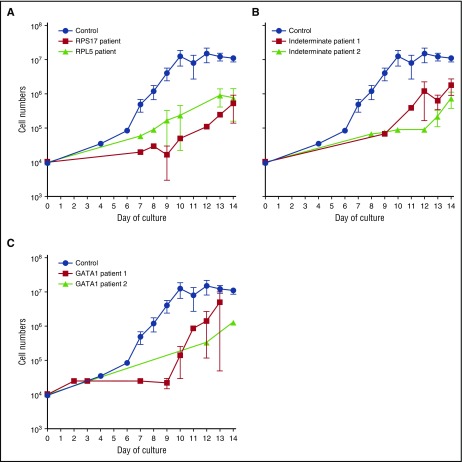
Figure 1.
Reduced proliferation of erythroid precursors of patients with DBA. Growth curves of CD34+ cells from control (n = 24) and DBA patients with RP gene mutations: RPS17 (red; n = 4) or RPL5 (black; n = 3) (A); control (n = 24) and DBA patients with unidentified mutations: unknown patient 1 (red; n = 3) and unknown patient 2 (black; n = 3) (B); and control (n = 24) and DBA patients with a GATA1 mutation: GATA1 patient 1 (red; n = 3) or GATA1 patient 2 (black; n = 1) (C). Data are presented as the mean ± standard error of the mean.

