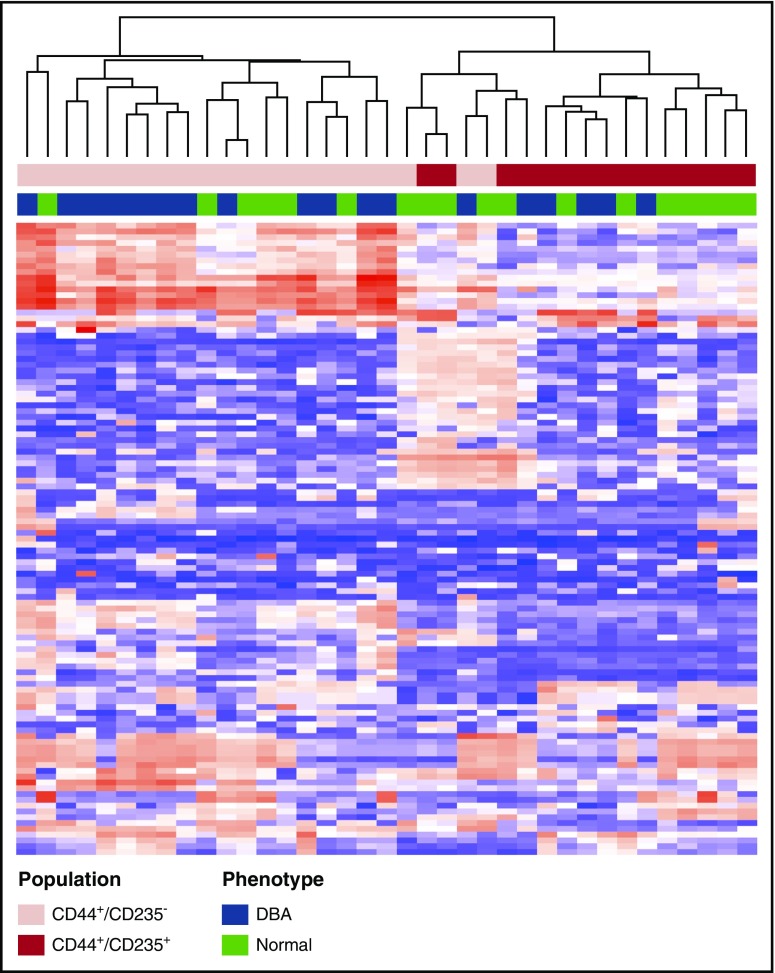
Figure 5.
Unsupervised hierarchical clustering of normal and DBA erythroid microarray profiles. Unsupervised hierarchical clustering of specimens by expression levels of the most variant features (coefficient of variation is ≥30% across all DBA [blue] and normal [green] control samples) shows partitioning (top dendrogram split) predominantly by differentiation stage rather than by disease status. The cell populations assayed are CD41−/CD44+/CD235− (pink) and CD41−/CD44+/CD235+ (burgundy).

