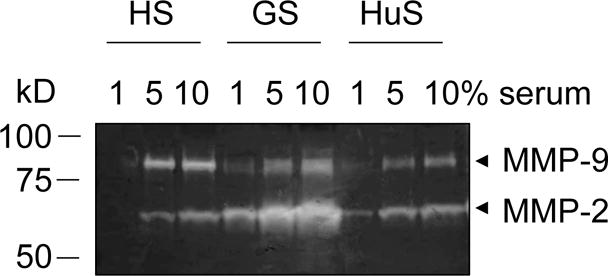
Figure 1.

Gelatin zymography gel loaded with different dilutions of horse serum (HS), goat serum (GS), and human serum (HuS) (1, 5, 10%). Stronger bands of MMP-2 (~ 65 kD) and MMP-9 (~ 85 kD) are visible with increasing concentrations of the different sera.
