
Fig. 3.
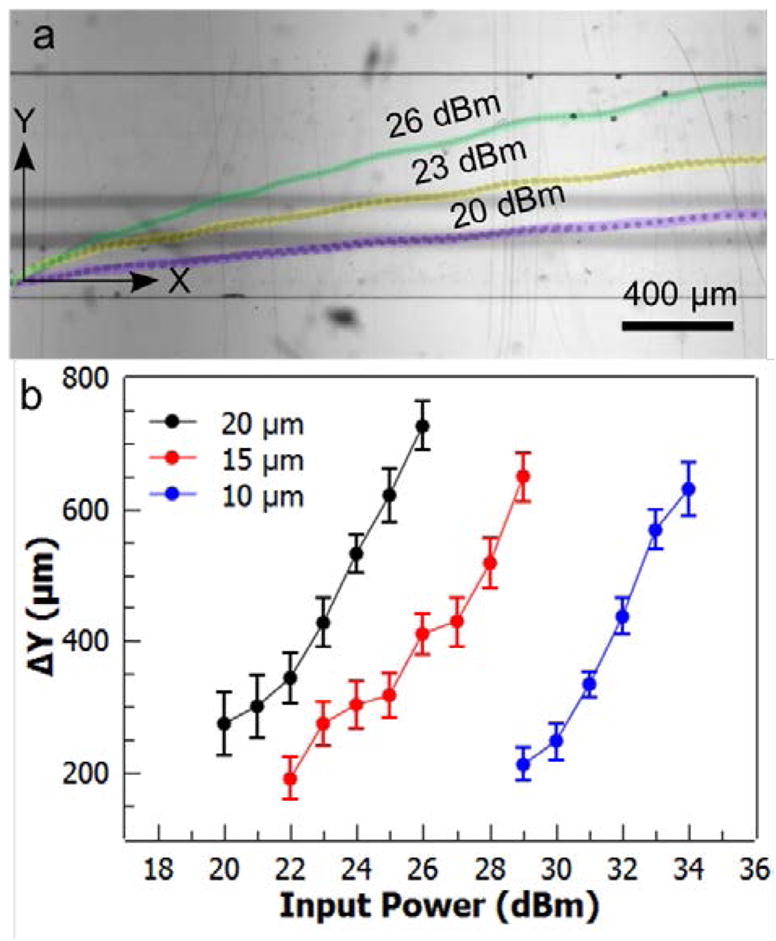
Characterization of particle deflection. (a) Stacked images of 20.33 μm particles crossing the microchannel at different acoustic powers. (b) Deflections of 9.51, 15.45, and 20.33 μm polystyrene particles are plotted at varying acoustic power values. Error bars represent standard deviation (n = 10).