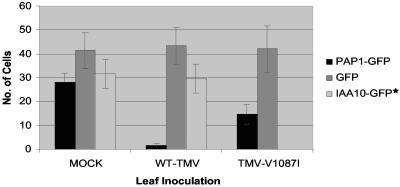
FIG. 7.
Expression and localization totals of GFP, PAP1-GFP, and IAA10-GFP constructs in noninfected (mock-infected), WT-TMV-infected, and TMV-V1087I-infected tissues. GFP bars represent the numbers of cells displaying detectable levels of GPF fluorescence within a 15-mm2 leaf area at 16 h posttransformation. PAP1-GFP and IAA10-GFP bars represent the numbers of cells displaying detectable levels of nucleus-localized GFP fluorescence. Values are the mean numbers of cells ± standard errors of the means (error bars) for six independent bombardment transformations. Note that IAA10-GFP was not tested in TMV-V1087I-infected tissues (IAA10-GFP*).

