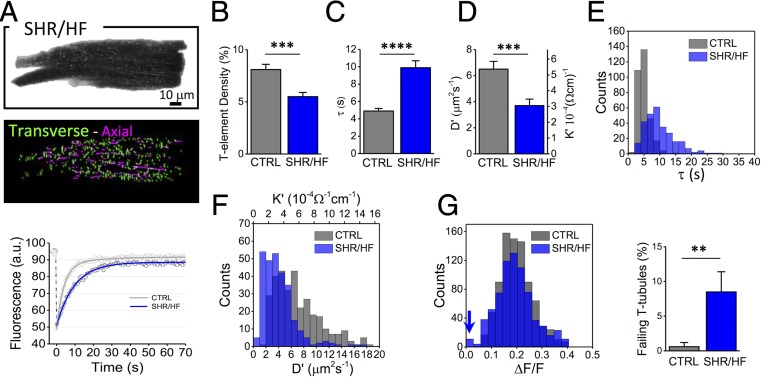
Fig. 5.
TATS conductivity in failing hearts. (A, Top) Representative confocal image of a ventricular cardiomyocyte, isolated from an SHR/HF stained with fluorescent dextran. (Middle) Skeletonized T-tubules, obtained with AutoTT (transverse elements in green and axial ones in magenta). (Bottom) FRAP data and best fit related to the average of 10 different tubules from CTRL (gray) and SHR/HF (blue) cells. (B–D) Graphs showing T-tubular density, diffusion time constant (τ), diffusion coefficient (D′), and electrical conductivity coefficient (K′). Data reported as mean ± SEM from n= 21 cells from N = 5 CTRL rats and n = 19 cells from N = 4 SHR/HF rats. (E and F) Distributions of diffusion time constant (τ), diffusion coefficient (D′), and electrical conductivity coefficient (K′) of single T-tubules in CTRL (gray) and SHR/HF (blue). Data from 315 T-tubules (CTRL) and 279 T-tubules (SHR/HF) from N = 5 and N = 4 rats, respectively. (G) Optical recording of T-tubular AP. The histogram compares the distributions of AP amplitudes recorded in TATS (expressed in ΔF/F) in CTRL and SHR/HF. The blue arrow highlights the presence of T-tubules that fail to depolarize during an AP. Columns showing the percentage of electrically failing T-tubules in CTRL and SHR/HF myocytes. T-tubules are scored as failing elements using the AP threshold of ΔF/F = 0.037 in agreement with previous work (11). Data from 87 T-tubules in n = 25 cells, isolated from N = 8 CTRL rats and 87 T-tubules in n = 23 cells, isolated from N = 8 SHR/HF rats. Student’s t test applied, **P < 0.01, ***P < 0.001, and ****P < 0.0001.

