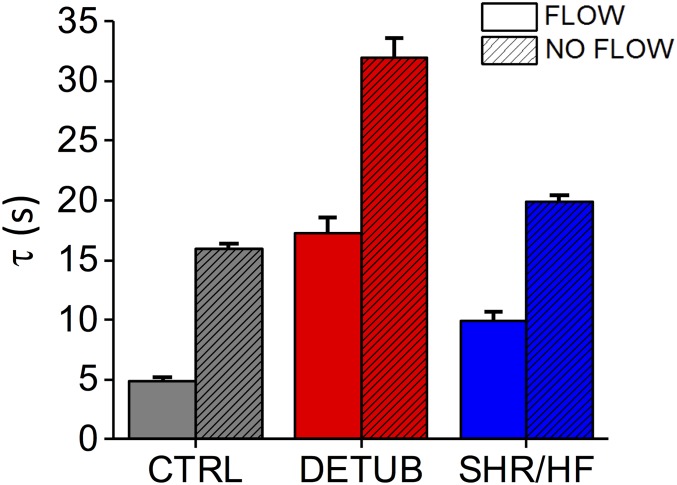
Fig. S4.
Graph comparing diffusion time constant () with and without flow in the perfusion bath in three different experimental settings: control (CTRL), detubulated cells (DETUB), and spontaneously hypertensive rats (SHR/HF). Data reported as mean ± SEM from n = 21 cells from N = 5 CTRL rats, n = 15 DETUB cells from N = 4 rats, and n = 19 cells from N = 4 SHR/HF rats in presence of flow; n = 58 cells from N = 6 CTRL rats, n = 42 DETUB cells from N = 6 rats, and n = 42 cells from N = 5 SHR/HF rats.

