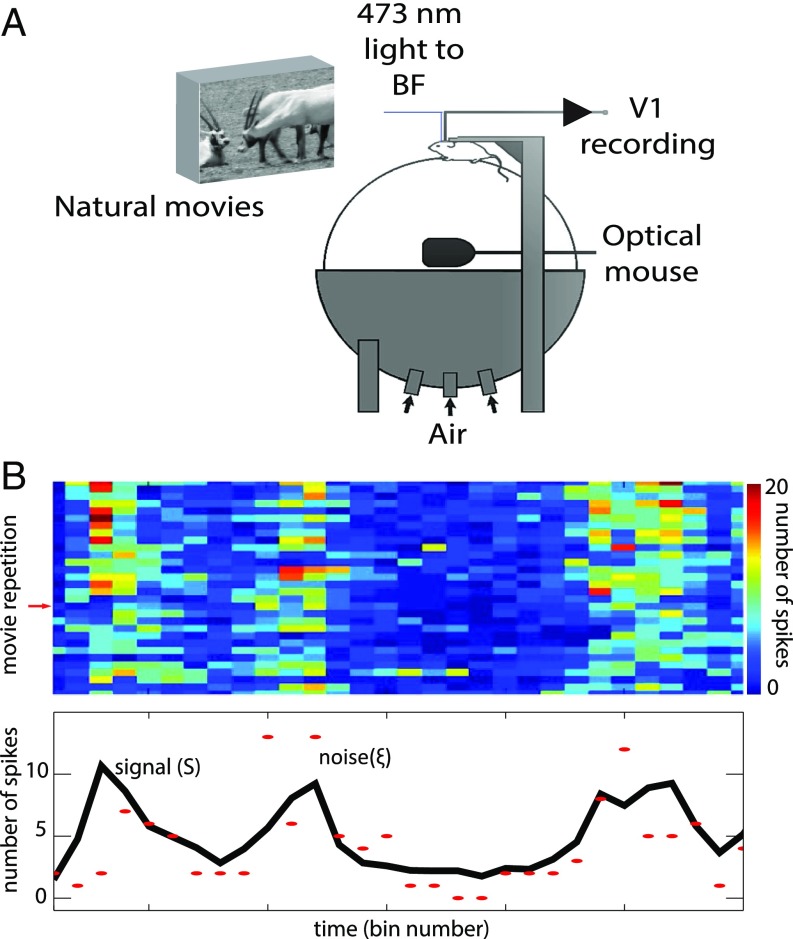
Fig. 1.
Experimental setup, signal and noise estimation. (A) Experimental setup, adapted from ref. 3. (B) We presented 30 repetitions of a movie sequence and calculated the spike count in consecutive time bins (Top). The signal (black line, Bottom) is estimated as the average number of spikes over all repetitions. The red markers represent the spike counts corresponding to a given repetition (marked with a red arrow on the Top). The noise is estimated as the difference between the signal and the spike count. From the estimations of the signal and the noise, we calculate the signal and noise correlations of neuronal pairs (Methods for a precise mathematical definition of signal, noise, amplitudes, and correlations).

