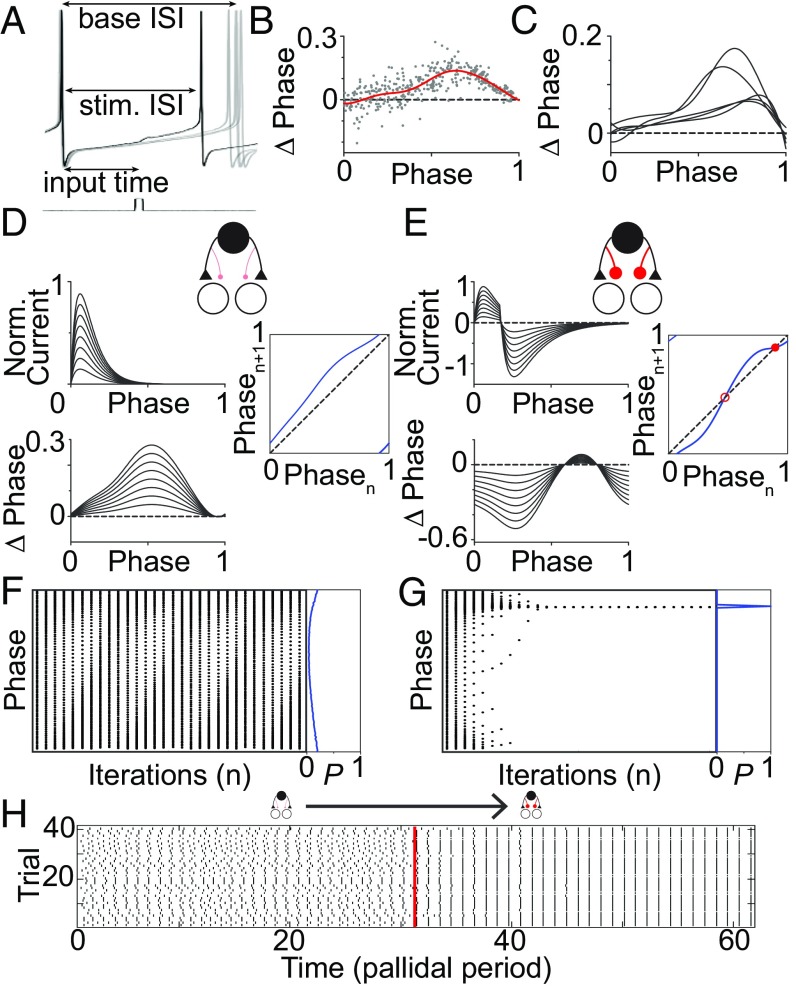
Fig. 4.
Experimentally measured pallidal iPRC constrains simple model of how DA affects the area X microcircuit. (A) Example of pallidal phase shifts caused by small current pulse (50 pA, 2 ms). (B) Phase shifts caused by single current pulses in a pallidal neuron. Red curve represents analytic fit to those points (R2 = 0.52). (C) Individual fits to five pallidal neurons show qualitative similarity. (D) We convolved the normalized EPSC (Upper Left) with the parameterized iPRC (C) to obtain the microcircuit PRC (Lower Left). Multiple synaptic strengths are shown. (Right) Firing map iteratively relating the phase of the pallidal neuron at the onset of one input to its phase at the time of the next input. (E) Same as in D but for linked excitatory–inhibitory (EI) synaptic events. Filled red circle in firing map indicates a stable fixed point; open red circle indicates unstable fixed point. (F) Trajectory of the firing phases of pallidal neuron ensemble relative to excitatory neuron under excitatory (E) microcircuit drive. (Left) Pallidal phase ensemble evolution under firing map drive across multiple initial conditions (Fig. 4D). (Right) Blue line plots the resulting phase probability distribution. Note lack of convergence to a single phase (high entropy, low synchrony). (G) Same as in F for EI microcircuit drive. Note convergence of pallidal ensemble to a single phase (low entropy, high synchrony). (H) Change in firing of pallidal ensemble over time as microcircuit shifts from excitation only to mixed excitation and inhibition. Each dot represents a pallidal neuron firing event, and each row indicates the progression of a single trial with a different, randomly selected initial phase. Vertical red line indicates the time when the microcircuit switched.

