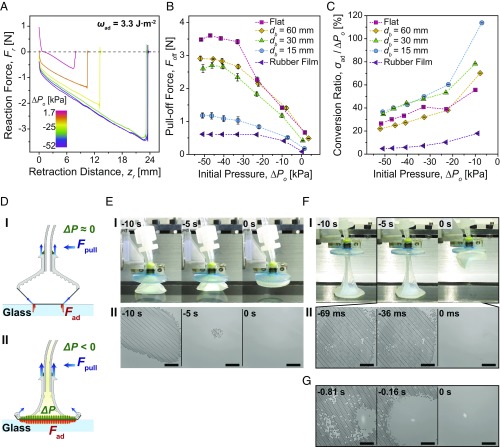
Fig. 5.
Characterization results of the soft adhesion system. (A) Measured reaction force (Fr) profiles on a flat glass surface with respect to retraction distance, depending on different initial pressures (ΔPo). (B) Measured pull-off forces (Foff) on various substrates depending on the initial pressures. (C) Conversion ratio (σad/ΔPo) on various substrates as a function of initial pressure. Each point in B and C indicates an average of five measurements, and error bars are ±1 SD. (D) Schematics of the soft system being pulled off from the flat glass without a change in the internal pressure (I), and under a high negative pressure differential (ΔP) (II). (E) Side views of the soft system being pulled off from the flat glass at 1.7 kPa of the initial pressure (I), and corresponding microscopic images of the contact interface (II). The estimated crack propagation speed is 1.5 m·s−1. (F) Side views of the soft system being pulled off from the flat glass at −52 kPa of the initial pressure (I), and corresponding microscopic images of the contact interface (II). The estimated crack propagation speed is 179 m·s−1. (G) Microscopic images of the contact interface of the soft system with a less adhesive FAM being pulled off from the flat glass at −46 kPa of the initial pressure. (Scales in E, II, F, II, and G indicate 1 mm.) The moment at which the FAM is detached is set to be 0 s.

