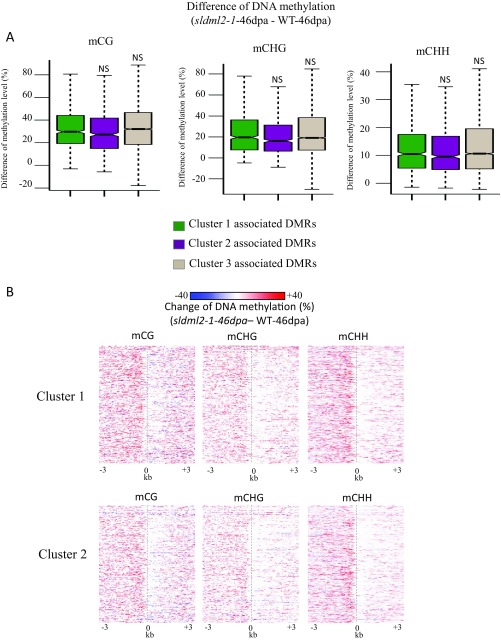
Fig. S5.
Cluster 1, 2, and 3 genes are hypermethylated in sldml2-1-46dpa vs. WT-46dpa. (A) Boxplots showing changes in DNA methylation levels at different groups of DMRs in sldml2-1-46dpa compared with WT-46dpa (NS, not significant, one-tailed Wilcoxon rank sum test). (B) Changes in DNA methylation levels of cluster 1 and cluster 2 genes in sldml2-1-46dpa relative to WT-46dpa. The sequences flanking cluster 1 and 2 genes are aligned, and mCG, mCHG, and mCHH levels for each 100-bp interval are plotted. The dashed line marks the positions of transcription start sites.

