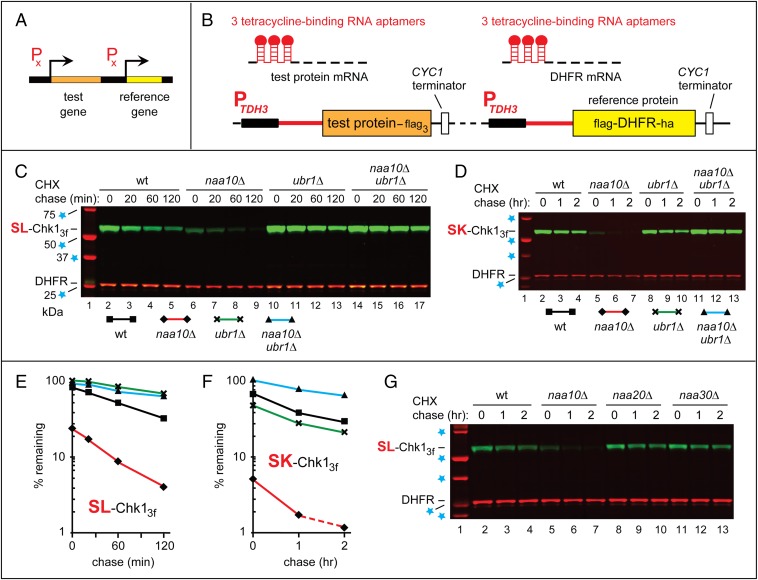
Fig. 2.
The PRT and degradation of Chk1 in naa10Δ cells. (A and B) The PRT. See the main text for a discussion. (C) Lane 1, kDa markers. CHX-chases, using PRT with wild-type SL-Chk13f, were performed at 30 °C for 0, 20, 60, and 120 min, with wild-type (lanes 2–5), naa10Δ (lanes 6–9), ubr1Δ (lanes 10–13), and naa10Δ ubr1Δ (lanes 14–17) S. cerevisiae. Extracts were prepared from cells withdrawn at the indicated times of a chase. Proteins in an extract were fractionated by SDS/PAGE, followed by immunoblotting with anti-flag and anti-HA antibodies. (D) As in C, but CHX-chases, with the SK-Chk13f mutant, were for 0, 1, and 2 h, with wild-type (lanes 2–4), naa10Δ (lanes 5–7), ubr1Δ (lanes 8–10), and naa10Δ ubr1Δ (lanes 11–13) S. cerevisiae. (E and F) Quantification of data in C and D, respectively. For curve designations, see the keys below the immunoblots in C and D. All degradation assays in this study were performed at least twice, yielding results that differed by less than 10%. (G) As in C, but CHX-chases, with wild-type SL-Chk13f, were for 0, 1, and 2 h, with wild-type (lanes 2–4), naa10Δ (lanes 5–7), naa20Δ (lanes 8–10), and naa30Δ (lanes 11–13) S. cerevisiae. In C, D, and G, lane 1 shows kDa markers and blue stars denote 25-, 37-, 50-, and 75-kDa proteins.

