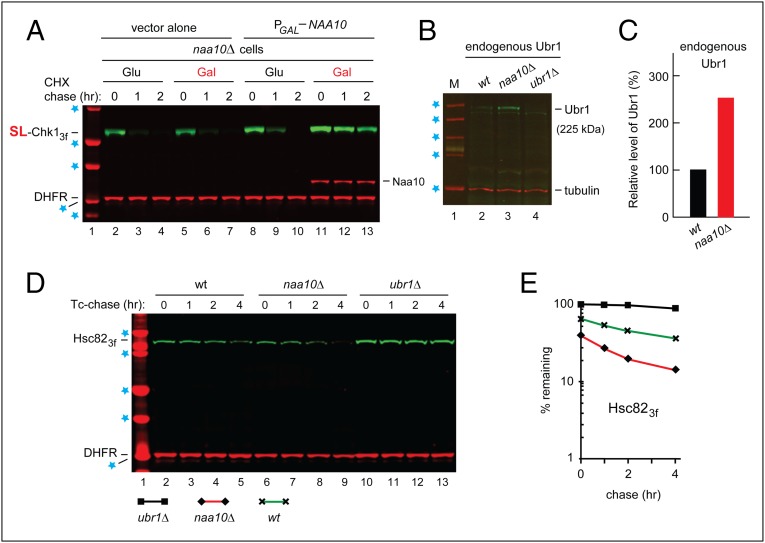
Fig. 3.
Degradation of Hsc82 by the Arg/N-end rule pathway in naa10Δ cells. (A) CHX-chases, using PRT (Fig. 2B), with wild-type SL-Chk13f, for 0, 1, and 2 h, with naa10Δ S. cerevisiae carrying a high-copy plasmid that expressed Naa10 from the PGAL promoter. Lane 1, kDa markers. Blue stars denote 20-, 25-, 37-, 50-, and 75-kDa markers, respectively. Lanes 2–4 and 5–7, cells (containing vector alone) in glucose and galactose medium, respectively. Lanes 8–10 and 11–13 are as in lanes 2–4 and 5–7, respectively, but with cells containing the PGAL-NAA10 plasmid. The presence of Naa10 was verified directly, using an affinity-purified antibody to Naa10 (bands in lanes 11–13, above the bands of DHFR). (B) Immunoblotting-based comparison of the levels of endogenous (untagged) Ubr1 in wild-type naa10Δ and ubr1Δ S. cerevisiae (with ubr1Δ cells as a negative control), using an affinity-purified antibody to Ubr1 (see the main text), with immunoblots of tubulin as a loading control. Blue stars denote 50-, 75-, 100-, 150-, and 250-kDa markers, respectively. (C) Quantification of the data in B, with subtraction of the background-level signal in lane 4 (ubr1Δ cells) and with the level of Ubr1 in wild-type cells taken as 100%. (D) Degradation of Hsc82 in naa10Δ cells. Blue stars denote 25-, 37-, 50-, 75-, and 100-kDa markers, respectively. Tc-chases, using PRT (Fig. 2B) with wild-type Hsc823f, were for 0, 1, 2, and 4 h, with wild-type (lanes 2–5), naa10Δ (lanes 6–9), and ubr1Δ (lanes 10–13) S. cerevisiae. Extracts were prepared from cells withdrawn at the indicated times of a chase. Proteins in an extract were fractionated by SDS/PAGE, followed by immunoblotting with anti-flag and anti-HA antibodies. (E) Quantification of data in D. For curve designations, see the keys below the immunoblot in D. All chases in this study were performed at least twice, yielding results that differed by less than 10%.

