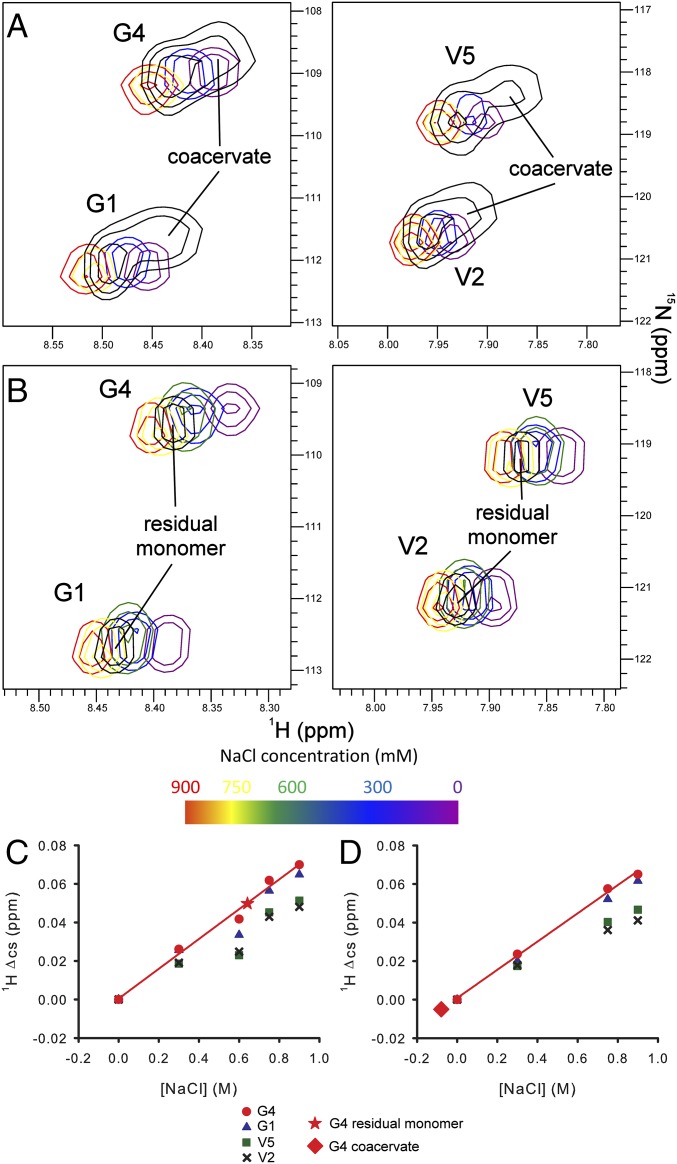
Fig. 3.
The 1HN chemical shift data reflect altered solution conditions within ELP3 coacervates. The HD peaks from 1H-15N HSQC spectra of ELP3 in 50 mM sodium phosphate, pH 7 with NaCl ranging from 0 to 900 mM are shown in each panel, highlighting the correlation between 1HN chemical shifts and the concentration of NaCl. (A) HSQCs acquired at 37 °C with an ELP3 in 50 mM sodium phosphate, pH 7 and 600 mM NaCl undergoing a phase transition are overlaid in black. (B) HSQCs acquired at 20 °C with residual monomer (coacervate was removed by centrifugation) postcoacervation overlaid in black. Changes in ELP3 monomer 1HN chemical shifts are plotted as a function of NaCl concentration at (C) 37 °C or (D) 20 °C, showing a clear linear dependence of chemical shift on salt concentration. Most HDs also exhibited a small protein concentration-dependent change in chemical shift, as shown by the lower than expected Δcs observed in the 0.6 M NaCl sample with 100 mg/mL ELP3. Linear least squares regression of Δcs (red lines) for the site with the smallest protein concentration dependence (G4) was used to estimate the NaCl concentration experienced by residual monomer (red star) or coacervate (red diamond) after LLPS.

