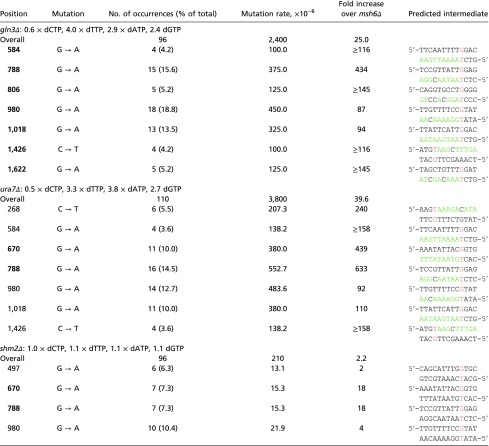
Table S7.
Mispair base substitution hotspots identified in gln3Δ, ura7Δ, and shm2Δ mutants
 |
Relates to Fig. 4. Mutations are shown relative to the coding strand. The predicted mutation is noted in red. Nucleotides following the mutation and which dNTP pools are increased in the mutants in comparison with WT are noted in green. dNTP levels are shown as fold over the WT (Fig. 4 and Table S5). The mutation spectra analysis was done in an msh6Δ background. Mutation hotspots that are significantly different to the msh6Δ control (Fisher’s exact test, value of P ≤ 0.05) are shown in bold.
