Fig. S7.
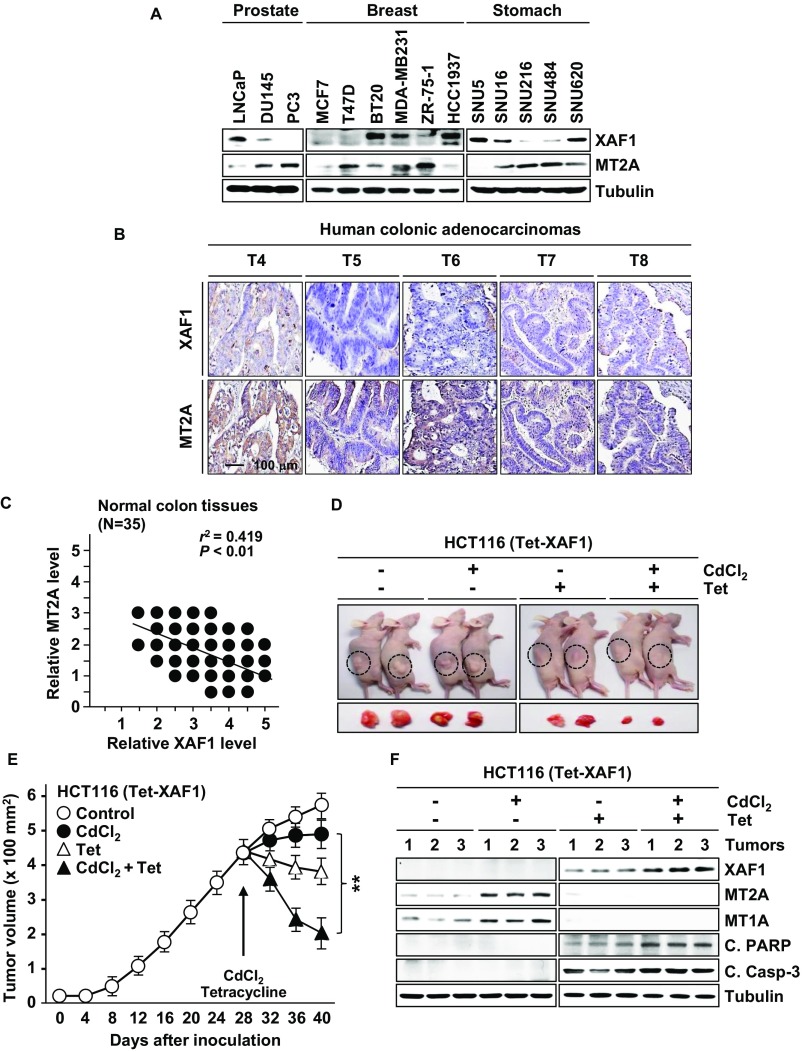
XAF1 and MT2A expression in human cancers. (A) Expression of XAF1 and MT2A in human cancer cell lines. (B) Immunohistochemical analysis of XAF1 and MT2A in primary colon cancers. T, tumor. (C) Immunoreactivity status of XAF1 and MT2A in 35 normal colon tissues. Relative staining levels were classified as levels 0–5. r, Pearson’s correlation coefficient. (D and E) Mouse tumor xenograft assays showing effect of XAF1 expression on tumor response to cytostatic metal stress (CdCl2, 0.02 mg/g). Data represent the mean ± SD (n = 3 per group; **P < 0.01). (F) IB assay of xenograft tumor tissues showing XAF1 effect on MT2A and MT1A and cleaved PARP and caspase-3 levels.

