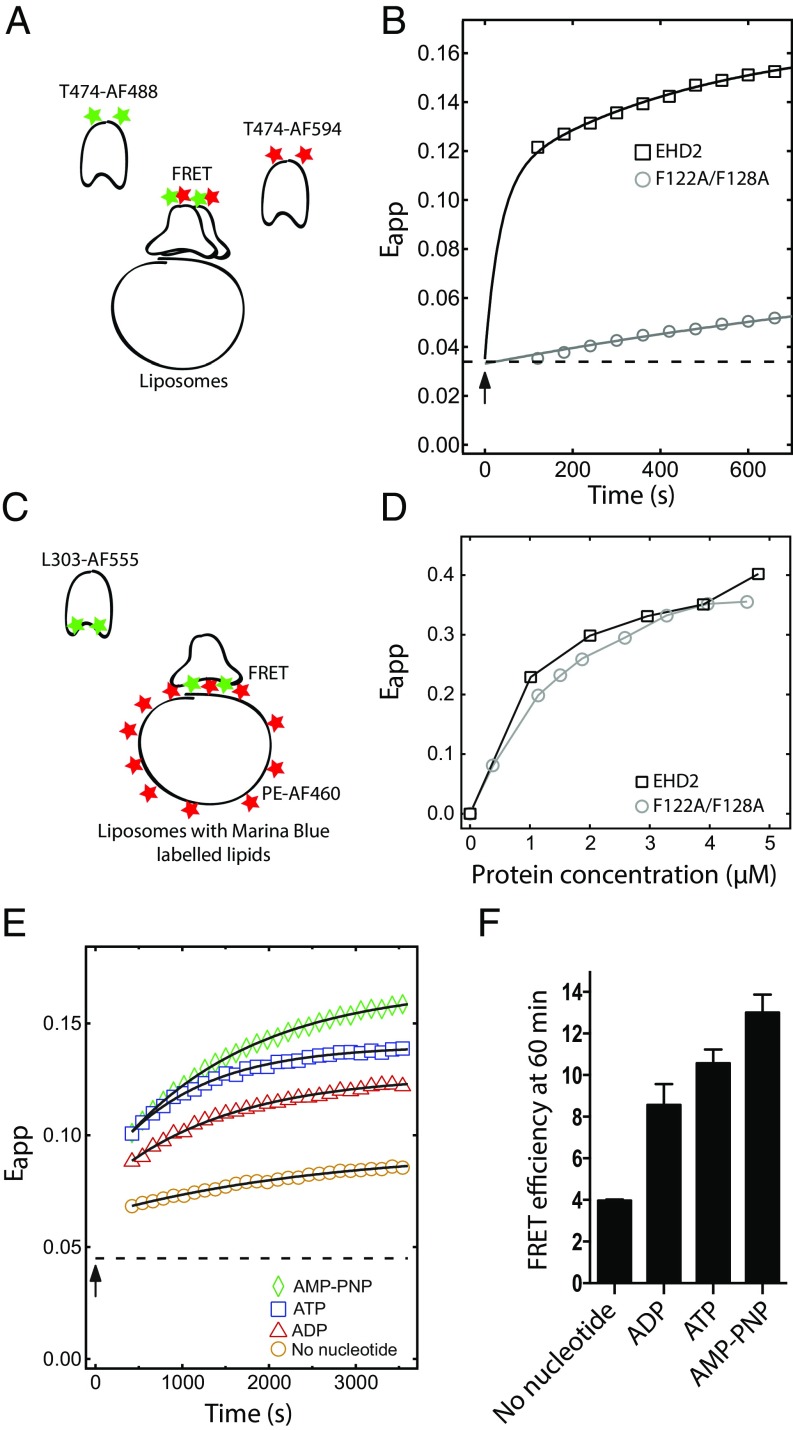
Fig. 2.
Oligomerization of EHD2 is ATP dependent and mediated via the loop in the G domain. (A) Schematic illustration of the FRET assay used in B and E. (B) FRET assay between EHD2 wild type or F122A/F128A labeled at T474 with AF-488 (donor) and AF-594 (acceptor) bound to AMP-PNP and mixed 1:1 (1 µM each) in presence of Folch liposomes (0.025 mg/mL). Apparent FRET efficiency (Eapp) over a time period of 600 s was determined by exciting the donor fluorophore at 488 nm, and the emission of the donor and acceptor was measured at 518 and 615 nm, respectively. The measurement starts 120 s after the addition of liposomes. Squares and circles represent recorded data, and the solid line represents a guide to the eye obtained from a biexponential fit as described in Methods. The arrow indicates liposome addition, and the dashed line, the initial apparent FRET efficiency before addition of liposomes. (C) Schematic illustration of the FRET assay used in D. (D) Binding curves for Marina Blue DHPE (1%)-labeled Folch liposomes and EHD2 or F122A/F128A protein labeled at L303 with AF-555. The indicated proteins were titrated against fixed concentration of lipids (0.2 mg/mL), and the apparent FRET efficiency was calculated by exciting the donor Marina Blue at 360 nm and measuring the emission of the donor and acceptor (AF-555–labeled protein) at 470 and 570 nm, respectively. (E) Nucleotide-dependent oligomerization of EHD2 wild type determined by FRET assay as described in B. EHD2 labeled at T474 with AF-488 and AF-594 was mixed 1:1 (1 µM each) in presence of indicated nucleotide or no nucleotide, and apparent FRET efficiency was calculated as in B over a time period of 3,600 s. The measurement starts 420 s after the addition of liposomes. Colored symbols represent recorded data, and the solid line represents the monoexponential fit. The arrow indicates liposome addition, and the dashed line, the apparent FRET efficiency before addition of liposomes. (F) Bar graph showing the quantification of apparent FRET efficiency at 3,600 s as performed in E. The data represent mean ± SD from three independent experiments.

