
FIGURE 3.
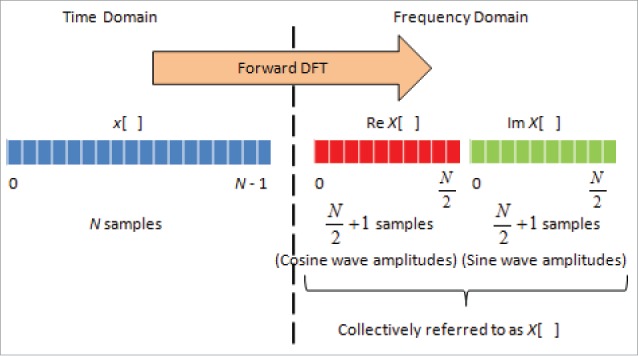
Fast Fourier Transform for conversion of signal from time to frequency domain. On the left is the signal in time domain of length N-1 samples, whereby the lower-case x[ ] represent signal value at every time point. Then, this signal is processed by forward DFT to give the frequency spectrum, whereby the amplitude X[ ] can be computed. Here, X[ ] has 2 components, whereby Re X[ ], being the real values, represents the amplitudes of the cosine wave, and Im X[ ], being the imaginary values, represents the amplitudes of sine wave, with each having a length of N/2+1. These are collectively referred to as X[ ], which sum up to a length of N-1.