
FIGURE 4.
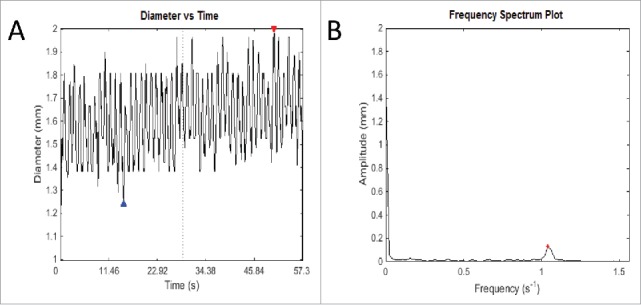
An example of the output of Fast Fourier Transform. (A) This graph records fluctuations in diameter of a transverse slice of intestine over time. The red and blue arrows represent the highest and lowest diameter respectively of that particular video analysis. Owing to the intrinsic width of the intestine, fluctuations cannot be about the zero mark, but rather around the length-dependent variable diameter of the intestine. (B) The frequency spectrum plot shows the most salient frequency – that is, the frequency with the highest amplitude, to choose the predominant frequency and amplitude. This allows elimination of other signals that contribute to ‘noise’ in the graph of diameter change over time, which ideally should be sinusoidal in shape. This method is used to eliminate human error in counting the number of contractions over time and using an average, which is used currently in the literature. As well as this, it allows more detailed information about the amplitude of contractions, which is difficult to measure, and as yet has not been studied in detail in gastrointestinal motility experiments in the literature.